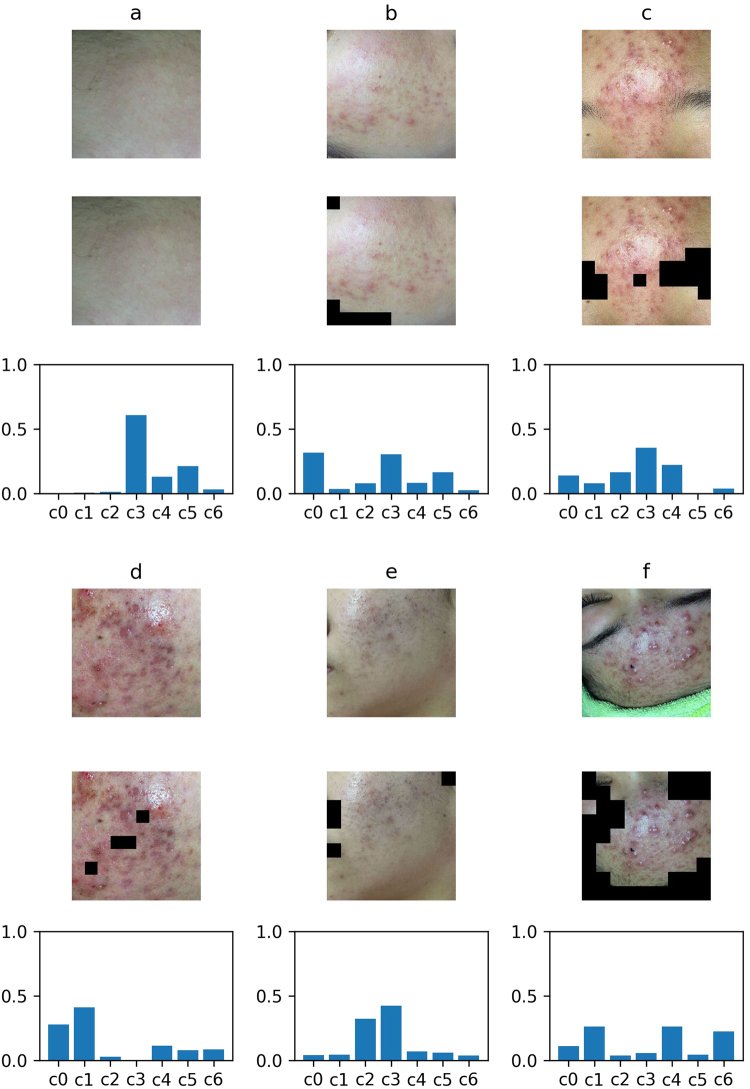
Figure 8.
The integral analysis of facial skin area (sec. 3.3) Six images with masks are the input images. The areas with black blocks are non-skin areas, the rest areas are skin areas. The result of integral analysis is shown with the histogram of corresponding proportions. Vertical coordinate of the histogram is the proportion value, abscissa is the type of symptoms, followed by papule (c0), cyst (c1), blackhead (c2), normal skin (c3), pustule (c4), whitehead (c5), nodule (c6).

