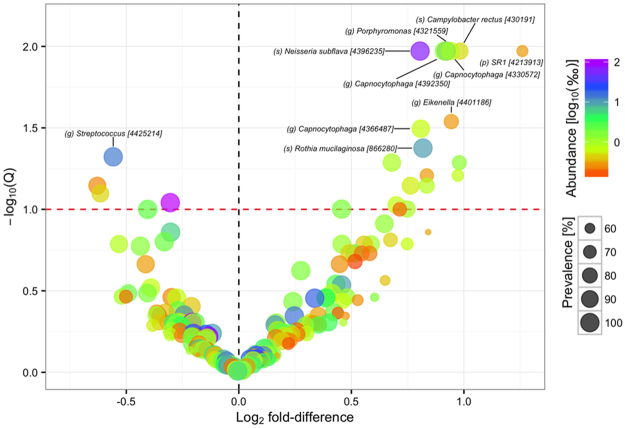
Figure 1.
Differential abundance of operational taxonomic units. Volcano plot of estimated log2 fold difference in operational taxonomic unit (OTU) abundance between vegans and omnivores and corresponding Benjamini-Hochberg adjusted P-values (Q) from negative binomial Wald tests as implemented in the DESeq2 R package. The red dotted line indicates the 10% false discovery threshold. Prevalence indicates percentage of participants in which a given OTU is present. Abundance indicates mean relative abundance (‰) of a given OTU. Name of OTUs differentially abundant at an FDR ≤ 5% are given at the lowest classified rank in Greengenes [Greengenes ID]. See Supplementary Table S2 for a full list of OTUs differentially abundant at an FDR < 10%. p, phylum, o, order. f, family. g, genus. s, species.

