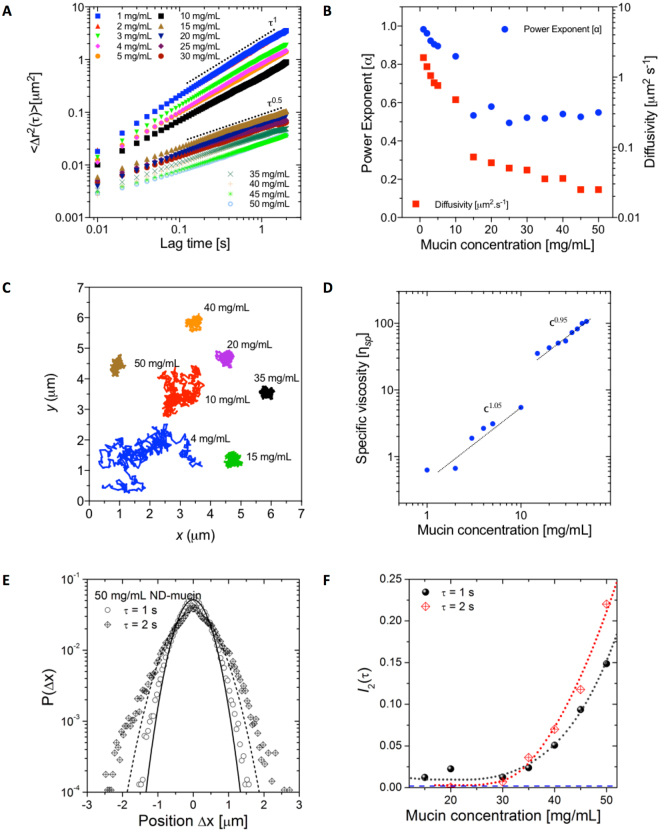
Figure 2.
Microrheological characterization of ND-mucin solutions. (A) The ensemble averaged MSD curves of 0.5 μm colloidal particles in 1 ≤ c ≤ 50 mg/mL ND-mucin. Two distinct regimes were observed in ND-mucin based on the power law of the MSD curves. The trend lines show the log-log scaling of τ1 and τ0.5 as guides to highlight the transition from diffusive behavior in solutions up to 10 mg/mL, to sub-diffusive for concentrations 15 mg/mL and above. (B) The dependence of power law exponents, α (left Y axis), and diffusivity coefficients, M (right Y axis), for 1 ≤ c ≤ 50 mg/mL ND-mucin. A transition is observed between 10 and 15 mg/mL where the power exponent becomes independent and diffusivity decreases with increasing concentration. (C) Representative trajectories of individual 0.5 μm fluorescent colloidal particles embedded within mucin solutions of increasing concentration. (D) Specific viscosity () scaling of 1 ≤ c ≤ 50 mg/mL ND-mucin. (E) Comparison of probability distributions of 0.5 μm colloidal particles movement in Δx-distances in a lag time of 1 s and 2 s for 50 mg/mL ND-mucin solution. The solid and dashed lines are Gaussian distributions for 1 s and 2 s, respectively fitted to the data. For lag time of 2 s, the deviation from Gaussian distribution is observed in the increased deviations in the tail regions, as well as the increased probability in the area around the maximum. (F) The excess kurtosis parameter I2(τ) plotted against mucin concentration for the lag times of 1 s and 2 s (dotted lines are parabolic spline to the data to guide the eye). For τ = 1 s and 2 s the degree of deviation was not measurable below concentrations of 10 and 20 mg/mL, respectively. A dashed line indicates I2(τ) for water.

