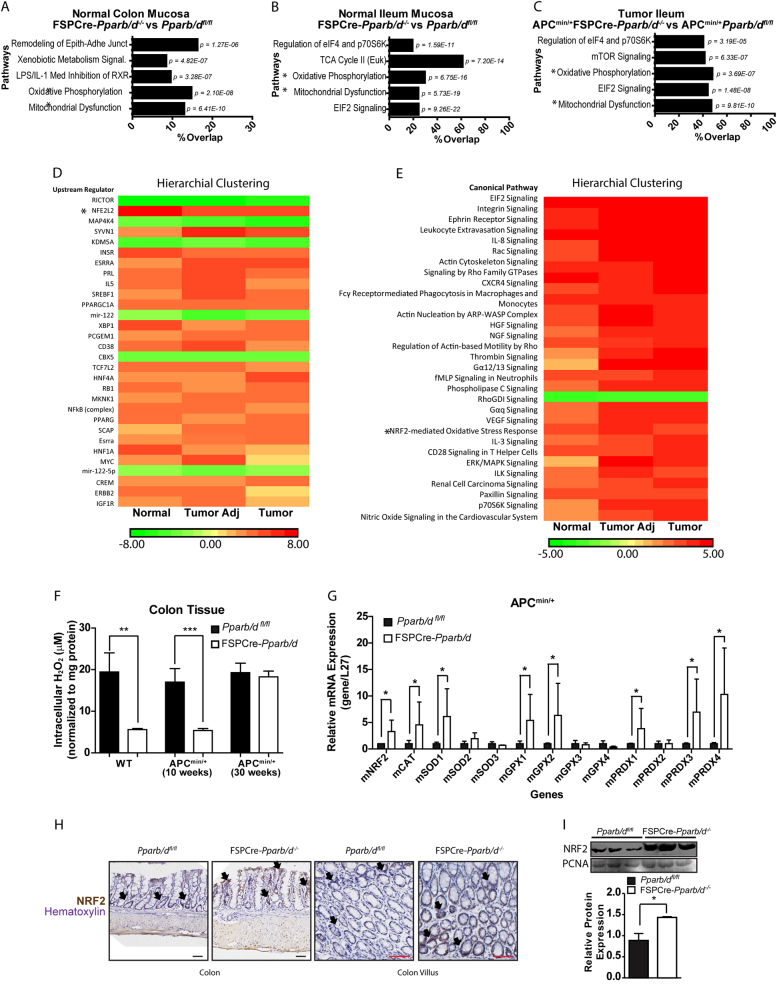
Fig. 3.
Fibroblast PPARβ/δ alters NRF2 and associated oxidative processes in FSPCre-Pparb/d−/− intestinal epithelium. a–c Gene Ontological Pathway Analysis of differentially expressed genes from colon mucosa (a), ileum mucosa (b), and intestinal tumor epithelium (c). Total RNA was isolated from LCM tissues using the Ambion RecoverAll Total Nucleic Acid Isolation Kit for FFPE and processed for array hybridization using the GeneChip WT Pico Kit and GeneChip Mouse Gene 1.0 ST Array gene chips. The data were normalized and analyzed using the Partek Genomics Suite v6.6. Multi-way ANOVA analysis was used to compare FSPCre-Pparb/d−/− (KO) against Pparb/dfl/fl (WT). Gene ontology (GO) analysis of gene subsets was performed using the Ingenuity Pathway Analysis software. The top five GO analysis were in descending order as determined by their p-value. Pathway analyses were conducted using Ingenuity Pathway Analysis (IPA), comparing FSPCre-Pparb/d−/− (KO) against Pparb/dfl/fl (WT) samples (n = 3; Fold change cutoff ≥ ± 1.3; p < 0.05). * Oxidative Phosphorylation and Mitochondrial Dysfunction were two common pathways placed in the top three most significant pathways across all tissues. d, e Unguided hierarchical clustering by upstream regulator (d) and pathway analysis (e) of differentially expressed genes in normal, tumor adjacent and tumor epithelium tissues from FSPCre-Pparb/d−/− (KO) and Pparb/dfl/fl (WT) mice. Our analysis also flagged NRF2-mediated oxidative stress response as an upregulated pathway in FSPCre-Pparb/d−/− colonic epithelium. *NFE2L2 (Nuclear factor erythroid 2-related factor 2) is a synonym of NRF2 (Nuclear factor erythroid 2-related factor 2). f Intracellular H2O2 levels in colons from FSPCre-Pparb/d−/− and Pparb/dfl/fl mice as determined by Amplex Red H2O2 assay. Samples were homogenized and supernatants incubated with appropriate reagents according to manufacturer’s instructions. Oxidation of Amplex Red results in the production of fluorescent resorunfin (571 nm ex and 585 nm em). A calibration curve was prepared (0–20 μM) and used to calculate H2O2 concentration of samples. The concentration of H2O2 was normalized to total protein. Data are represented as mean ± S.E.M. from at least four independent experiments. g Relative fold change in mRNA levels of 13 genes associated with oxidative stress response in APCmin/+FSPCre-Pparb/d−/− and APCmin/+Pparb/dfl/fl colons. Total RNA was extracted, and RT-qPCR was performed as described in legends of Fig. 1d, e. Ribosomal RNA L27 used as housekeeping gene. Values are mean ± S.E.M. (n = 4). *p < 0.05. h Representative images of immunohistochemical staining for NRF2 (black arrows) in FSPCre-Pparb/d−/− and Pparb/dfl/fl colons. Sections were counterstained with hematoxylin for visualization of tissue morphology. The number of NRF2-positive cells was recorded using ImageJ software version 1.45 s. Black arrows indicate representative NR2-positive regions. Scale bar: 50 µm. i Fold change in NRF2 protein in colons from FSPCre-Pparb/d−/− and Pparb/dfl/fl mice. Representative immunoblot and graph for NRF2 protein are shown. Samples were processs for western bllot as described in legends of Fig. 1d, e. PCNA that served as housekeeping protein were from the same samples. Data are represented as mean ± S.E.M. from at least three independent experiments

