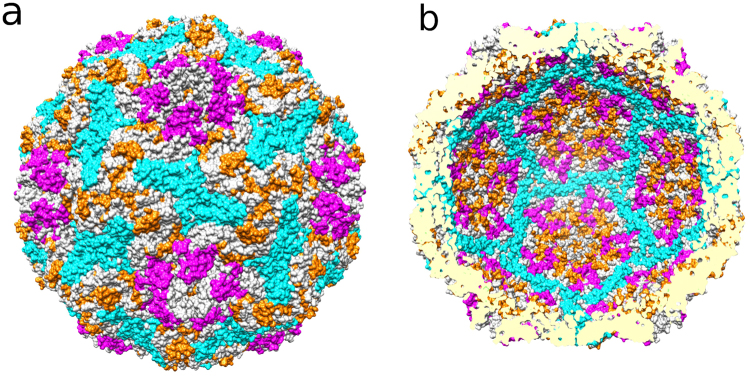
Figure 1.
Results of whole-virion HPeV1 RCAP. The top hits arising from each of the capsid proteins from the virion RCAP are shown on the HPeV1 model (PDB: 4Z92). (a) Visualized on the outer surface of the capsid, all but one hit span the capsid and are exposed on the inner surface too. (b) Regions identified by RCAP visualized on the inner capsid surface. The peptides from VP0 are cyan, VP1 are magenta and VP3 are orange. Note that the N-termini of VP0 and VP1, although in the top hits, are disordered and therefore not seen in this representation.

