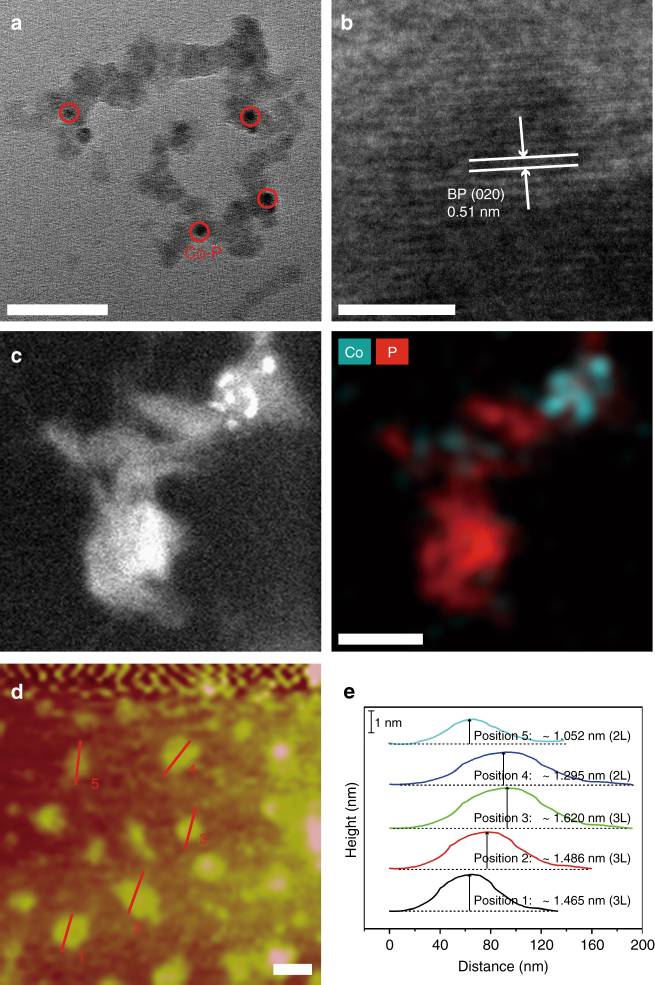
Fig. 2.
Morphology and structure of the Co-P/BP nanosheets. a, b TEM and HRTEM images of the Co-P/BP nanosheets. The red circles marked are amorphous Co-P nanoparticles and the nanosheet structure is BP. c EDX element mapping. The high-angle annular dark fields (HAADF) scanning transmission electron microscope (STEM) of the region of interest, as well as Co and P distribution, are shown. d, e AFM image and the corresponding height profiles of the Co-P/BP nanosheets. The scale bars are 50, 5, 40, and 20 nm in Fig. 2a, b, c, and d, respectively. In all panels, the mass ratio of P to Co is about 8

