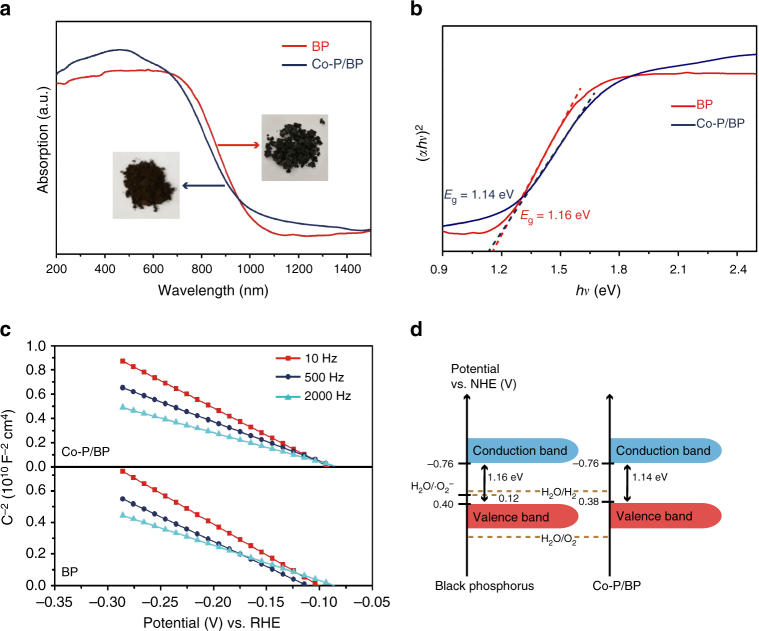
Fig. 3.
Bandgap states of the as-prepared BP-based samples. a UV–vis–NIR absorption spectra of the BP (red curve) and Co-P/BP (navy curve) nanosheets. The inset is digital photographs of the as-prepared samples. b (ahν)2 vs. hν curve for BP (red curve) and Co-P/BP (navy curve) nanosheets. The dashed lines are the tangents to the curves. The intersection value is the bandgap. c Mott–Schottky plots for the BP and Co-P/BP nanosheets from impedance measurements. The flat-band potentials were obtained from the intercepts of the extrapolated lines. d Band positions of the BP and Co-P/BP nanosheets from the bandgaps and flat-band potentials obtained from Fig. 3c

