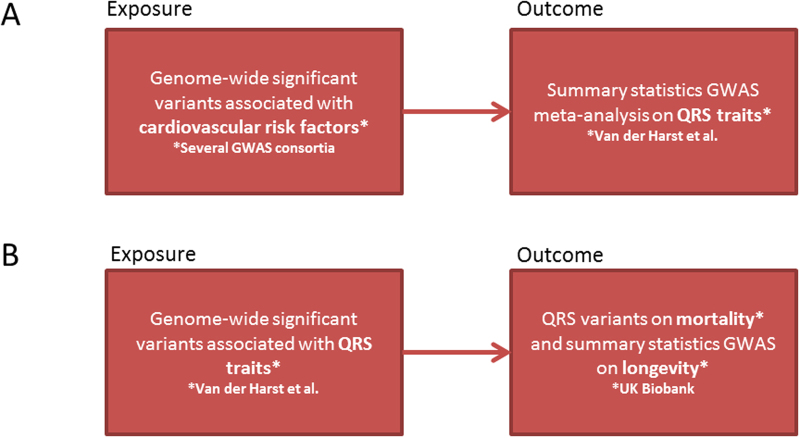
Figure 1.
Flow charts of the MR analyses performed. (A) Is the schematic presentation of the MR analyses of cardiovascular risk factors on QRS traits to determine which cardiovascular risk factors causally lead to changes in QRS duration and QRS amplitude. (B) Is the schematic presentation of the MR analyses of QRS traits on mortality and longevity to determine whether a causal relationship of QRS traits with mortality and longevity exists.

