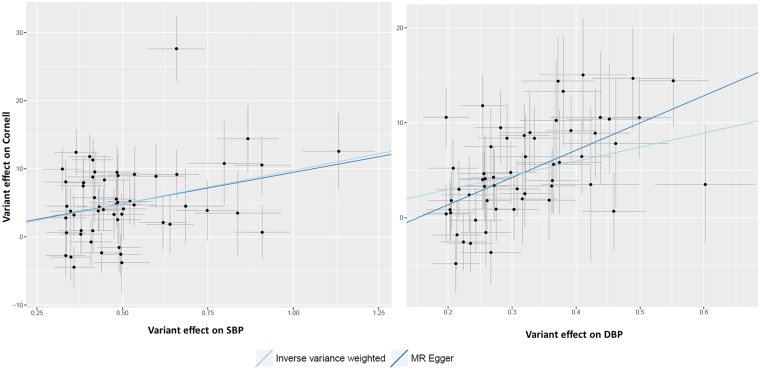
Figure 3.
Scatter plots: SBP and DBP associated with ECG Cornell criteria. On the X-axis the variant effects on blood pressure are displayed and on the Y-axis the variant effect on Cornell product. The light blue line is the regression line of the inverse-variance-weighted fixed-effects meta analyses. The dark blue line is the regression line of the MR Egger regression line. DBP = diastolic blood pressure, MR = Mendelian randomization, SBP = systolic blood pressure.

