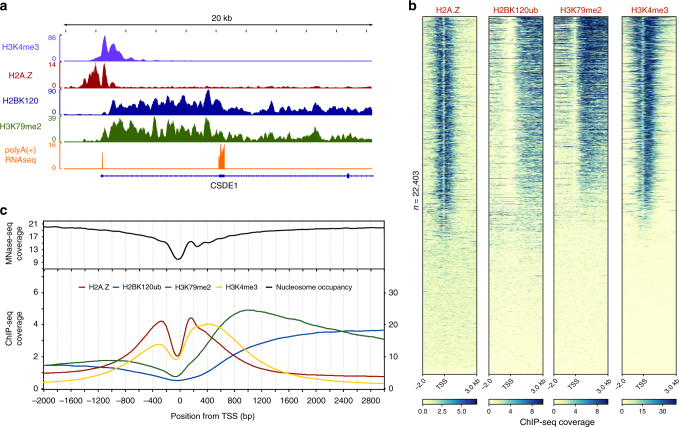
Fig. 4.
Genic localization of H2A.Z and H2BK120ub. a ChIP-seq tracks at the CSDE1 gene locus for the H2A.Z, H2BK120ub, H3K79me2, and H3K4me3 marks. b Heatmaps of H2A.Z, H2BK120ub, H3K79me2, and H3K4me3 ChIP-seq data around the TSS on a genome-wide scale. c Aggregate representation of genome wide data shown in b and nucleosome occupancy (by MNase-seq). H2A.Z, H3K79me2 and H2BK120ub are scaled to the left y-axis, whereas H3K4me3 is scaled to the right y-axis. All ChIP-seq, MNase-seq, and RNA-seq data are depicted as coverage, which is proportional to the number of sequencing reads at each genomic locus (see Methods)

