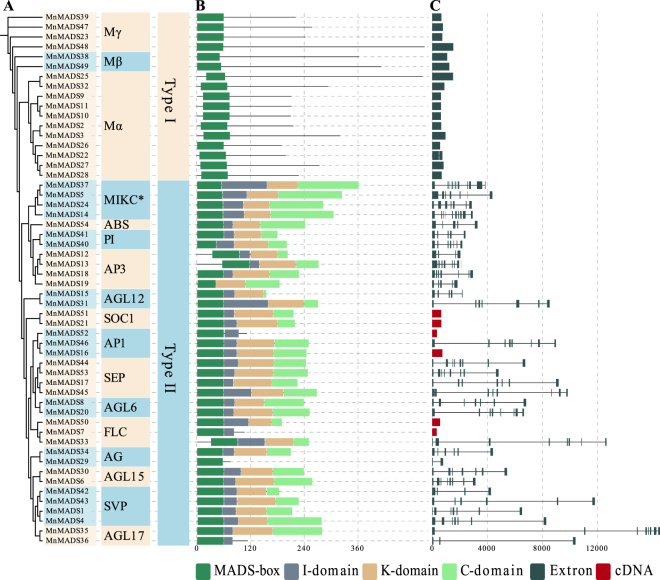
Figure 2.
Phylogenetic relationships and structural analyses of mulberry MADS-box genes. (A) The unrooted maximum likelihood tree of 54 MnMADS proteins was reconstructed using a JTT + I + G model. Groups are shown in different colors. (B) Domains of MADS-box, intervening (I), keratin-like (K), and C-terminal (C) are indicated by different colored broad lines. The length corresponds to motif length. (C) The broad grey lines and thin lines indicate exons and introns, respectively. Broad red lines indicate the full-length cDNA of MnMADS genes, which are manually modified according to the de novo transcriptome assembly data reported by Shang et al.50.

