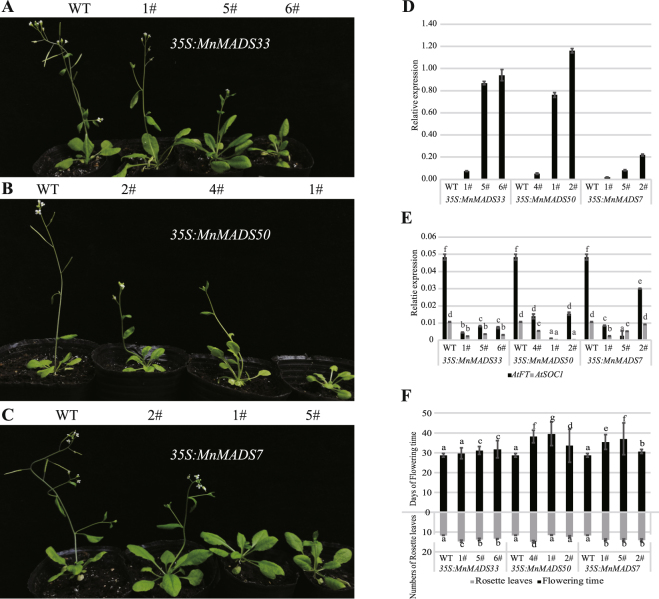
Figure 7.
Phenotypes of the wild-type and transgenic Arabidopsis thaliana plants overexpressing MnMADS33, MnMADS50, and MnMADS7. (A–C) Five-week-old wild and transgenic seedlings under long-day conditions (16/8 h of light/dark). (D) Expression levels of MnMADS33, MnMADS50, and MnMADS7 determined by qRT-PCR in wild-type and transgenic A. thaliana. (E) qRT-PCR analyses of AtSOC1 and AtFT in wild-type and transgenic A. thaliana. (F) The leaf numbers of rosette in wild and transgenic A. thaliana plants. For qRT-PCR analyses in (D,E), A. thaliana Actin7 is used as the internal control. Error bars represent the standard deviations of three independent experiments. Significant differences are indicated by different lower-case letters resulting from one-way Duncan’s test (P < 0.05).

