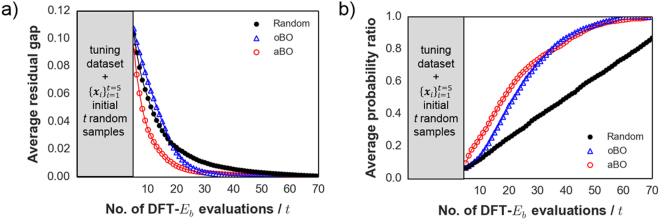
Figure 4.
(a,b) Performance comparison for additive BO (aBO), ordinary (oBO), and random search using the Li-tavorite dataset (averaged from 1000 trials). Horizontal axes for both denote the sequential number of DFT- evaluations . The vertical axis in a) shows the residual gap at step between optimal and the prior best solution (). The vertical axis in (b) shows the average probability ratio of discovering the optimal Li-tavorite compound . Note that both additive BO (aBO) and ordinary BO (oBO) search methods here used the tuned hyperparameters from half of the Li dataset excluded for search performance comparison (gray area).

