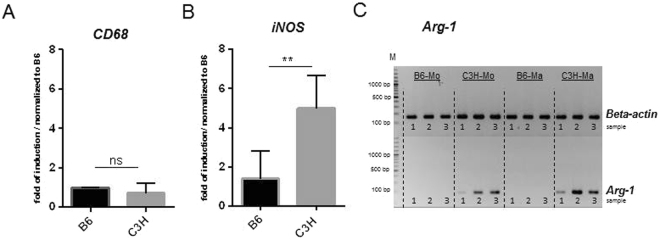
Figure 3.
Gene expression analysis in monocytes and macrophages. (A,B) Relative qPCR analysis of CD68 and iNOS. (C) RT-PCR analysis of Arg-1 and ß-actin in monocytes and macrophages of B6 and C3H mice. Images of Arg-1 and ß-actin were taken from 2 different parts of the same gel. The Numbers 1 to 3 stand for sample number. Expression of CD68 was used as a marker for the macrophage lineage, while iNOS expression was used to indicate M1 polarization, and Arg-1 expression was used to indicate M2 polarization (A,C). Monocyte-derived macrophages from B6 and C3H mice expressed equal levels of CD68, indicating equivalent differentiation to the macrophage lineage (A). C3H macrophages expressed higher levels of the M1 marker iNOS (B) and the M2 marker Arg-1 than B6 macrophages. No expression of Arg-1 was detected in B6 macrophages (C).

