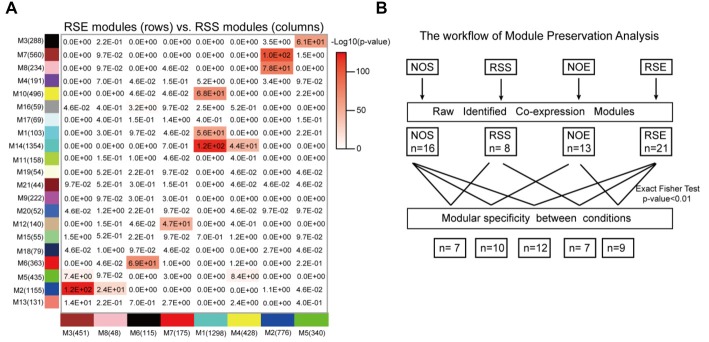
Figure 4.
Module specificity and preservation. (A) Perseveration of co-expression networks between RSE and RSS. Each square in the graph represents the degree of overlap between two modules. The number in the cell represents the probability of module preservation between two conditions. A hypergeometric two-tailed Fisher’s exact test was used to determine the probability. (B) Summary of module preservations for all four conditions.

