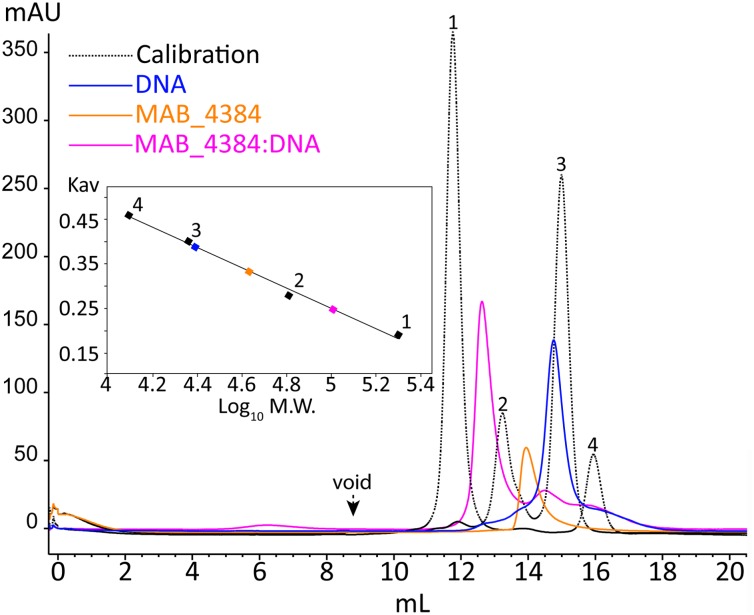
FIGURE 5.
Oligomerization of MAB_4384 and the MAB_4384:DNA complex in solution. The oligomeric states of MAB_4384 alone or complexed to its DNA target were determined by size exclusion chromatography. The elution profile of the proteins, used for the calibration is displayed as a dashed black line. Calibration was established using β-amylase (200 kDa) (1), bovine serum albumin (66 kDa) (2), carbonic anhydrase (29 kDa) (3), and cytochrome C (12.4 kDa) (4), eluting with estimated volumes of 11.7, 13.2, 14.9, 15.9 mL, respectively. The void volume was determined with the elution volume (8.8 mL) of dextran blue. MAB_4384 (dimer) was at a concentration of 3.9 mg/mL. The elution profiles of MAB_4384 dimer, DNA target and MAB_4384 bound to the DNA target are shown in orange, blue, and pink and their respective elution peaks were at 13.9, 14.7, and 12.6 mL. Kav indicates the partition coefficient.

