
FIGURE 2.
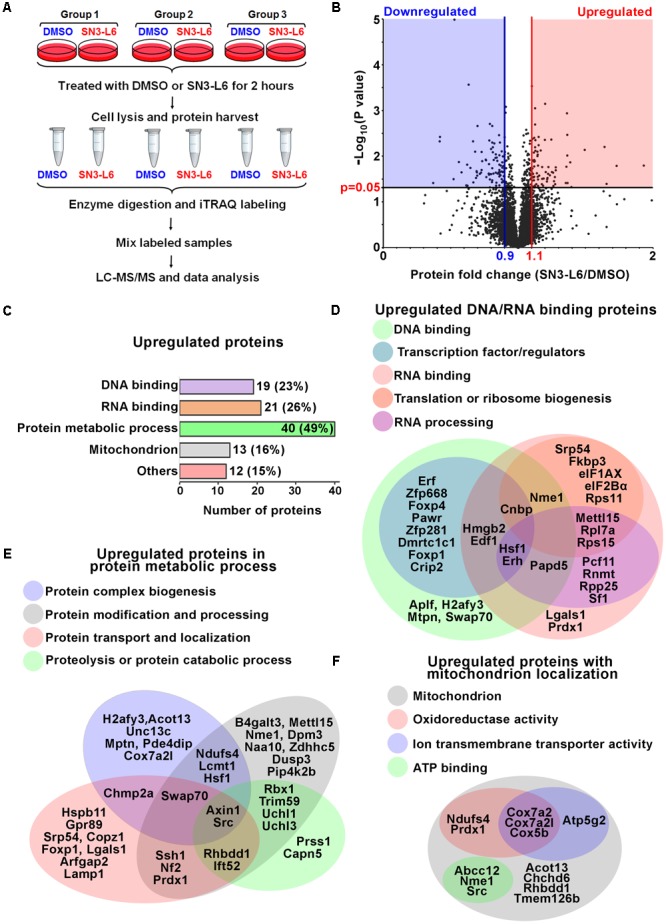
SN3-L6 upregulates proteins in DNA and RNA binding, protein metabolism and mitochondrial localization. (A) A schematic of the experimental procedures for isobaric tag for relative and absolute quantitation (iTRAQ) analysis. (B) A Volcano plot is drawn to show the distribution of all proteins identified by LC-MS/MS. Upregulated and downregulated proteins are defined by 1.1- and 0.9-fold change, respectively, with P-value smaller than 0.05 (distributed in red and blue areas of the plot, respectively). (C) Numbers of proteins that are involved in DNA binding, RNA binding, protein metabolic process and mitochondrion localization. Venn diagrams are drawn to show classifications of individual proteins involved in DNA and RNA binding (D), protein metabolic process (E), and mitochondrion localization (F).