FIGURE 5.

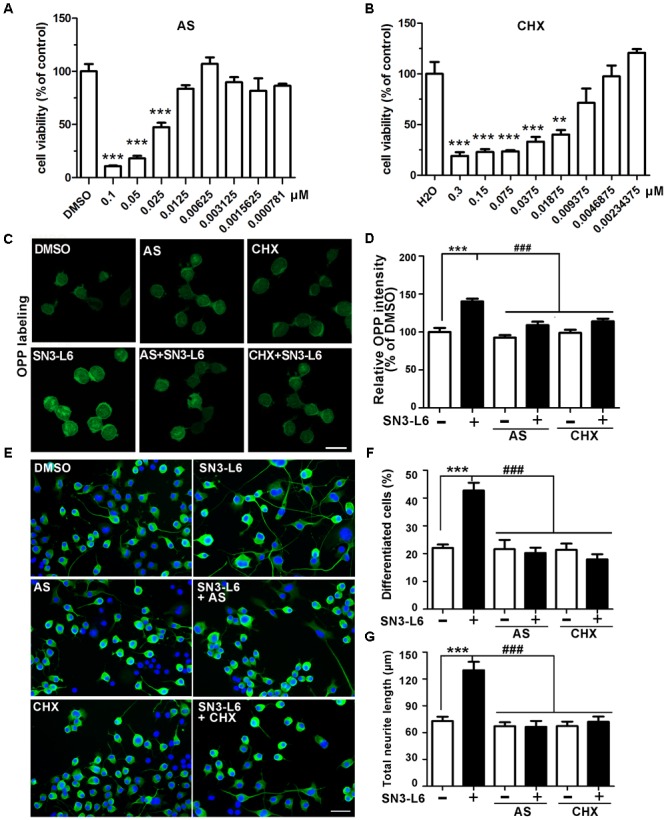
Neuronal differentiation induced by SN3-L6 depends on translation. Neuro-2a cells were treated with different concentrations of AS (A) and CHX (B) for 48 h. Cell viability was performed by MTT assay. ∗∗∗P < 0.001, ∗∗P < 0.01, AS vs. DMSO or CHX vs. H2O. (C) Representative images of OPP labeling of newly synthesized polypeptides treated with SN3-L6 together with AS (12.5 nM) or CHX (9 nM). Scale bar, 20 μm. (D) Quantification of OPP signal intensity. ∗∗∗P < 0.001, SN3-L6 vs. DMSO; ###P < 0.001, AS or CHX vs. SN3-L6. (E) Representative images of Neuro-2a cells treated with SN3-L6 (25 μM), AS (12.5 nM) or CHX (9 nM). Neurites and nuclei were visualized using β-tubulin III antibody (green) and DAPI (blue), respectively. Scale bar, 50 μm. Percentage of differentiated cells (F) and total neurite length (G) are quantified. ∗∗∗P < 0.001, SN3-L6 vs. DMSO; ###P < 0.001, AS or CHX single or co-treatment with SN3-L6 vs. SN3-L6. All data shown in this figure are presented as mean ± SEM from at least three independent experiments. Statistical analysis was subjected to one-way ANOVA with Bonferroni multiple comparison test.
