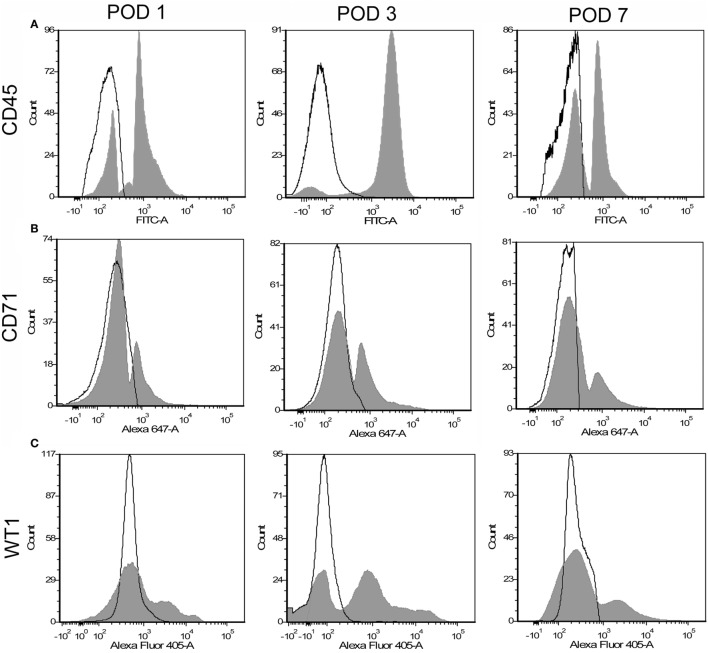
Figure 4.
Flow cytometry profile of pleural fluid cells after surgical resection. Representative single parameter histograms of CD45+ (A), CD71+ (B), and WT1+ (C) cells at three time points after surgery: postoperative days (POD) 1, 3, and 7 (gray). Negative controls (white) reflect samples without detection antibody.

