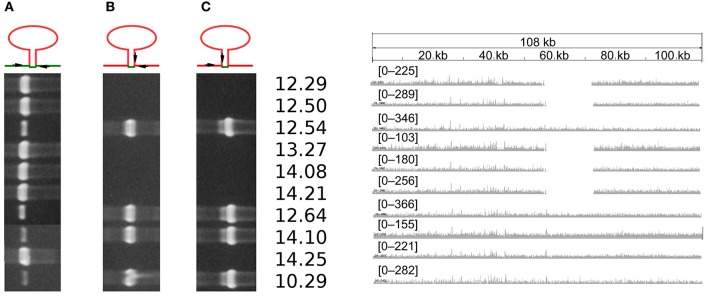
Figure 4.
Evidence of integration/excision of Tn6212. (Left) Agarose gels of PCR amplification products with (A) primers fX1/rX4 (686 bp) that amplify the chromosome region resulting from excision, (B) primers fX3/rX4 (739 bp) that amplify the downstream transposon junction, and (C) primers fX1/rX2 (933 bp) that amplify the upstream transposon junction, as indicated in the top scheme of PCR primers positions. (Right) Density of reads mapping on Tn6212 and flanking regions. The numbers indicate the CRAFRU strains.

