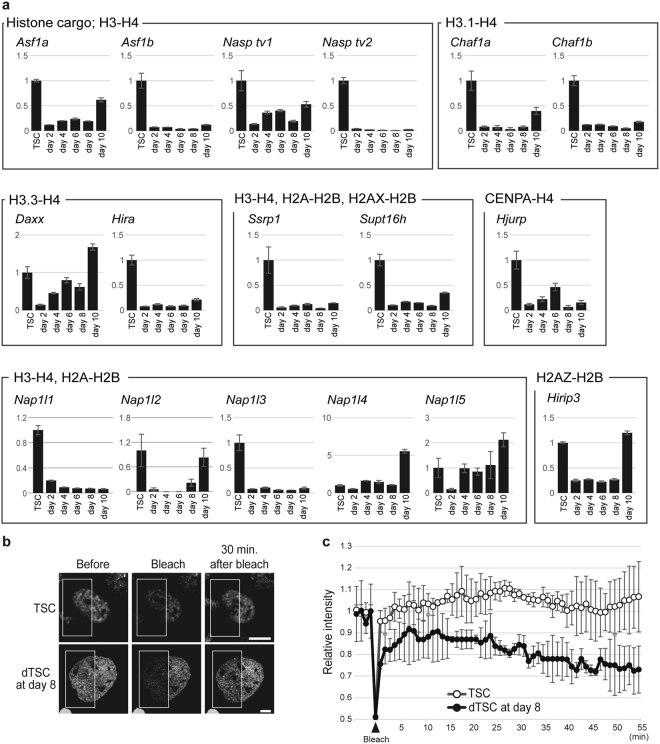
Figure 7.
Repertoire of histone chaperones and mobility of histones are limited in dTSCs. (a) Expression of genes encoding histone chaperones. Graphs show the expression level of various histone chaperones determined using RT-qPCR. Values indicate the mean ± S.D. after being normalized to Actb expression, and are indicated relative to the levels in TSCs, which were arbitrarily set as 1. (b,c) FRAP analysis for H4-GFP-TSCs and -dTSCs at day 8. One-half of the nuclei of living H4-GFP-TSCs and -dTSCs at day 8 was bleached (white squares in b), and the averages of the relative fluorescence intensity (mean ± S.D.) of the bleached area up to 55-min post-bleaching are plotted (n = 10) (c). Bars = 5 μm.

