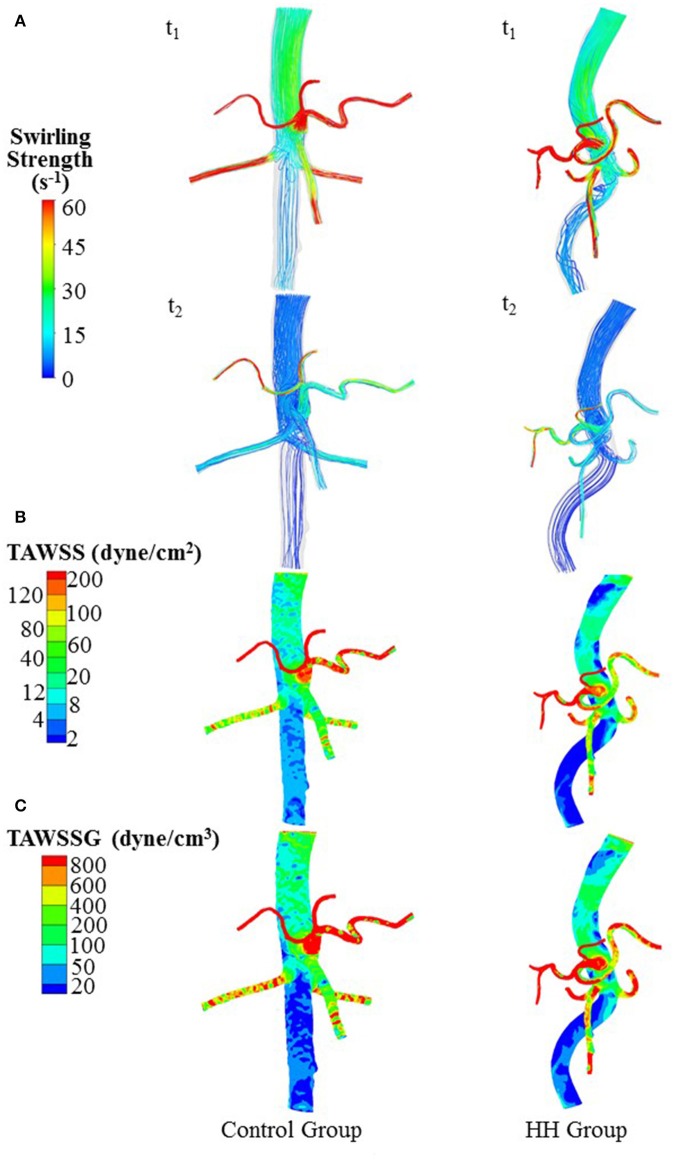
Figure 4.
(A) Flow streamlines (unit: s−1) at time instances with the highest and lowest flow velocities at the inlet of TA (i.e., t1 and t2 in Figure 3B), (B) TAWSS (unit: dynes/cm2), and (C) TAWSSG (unit: dynes/cm3) in a representative control and a representative HH patient.

