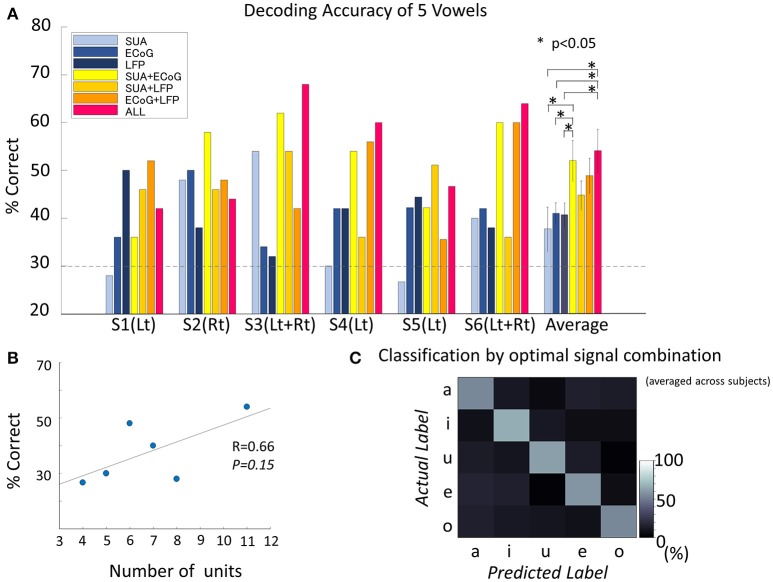
Figure 5.
Decoding accuracy of vowels. (A) Decoding accuracy of five spoken vowels displayed as a function of input from various features/feature combinations. The dashed light gray line indicates the significance level (significance level = 30%, Binominal test, 50 trials, 5 classes, alpha = 0.05). The group of bars on the far right shows the results averaged across subjects and the standard deviation. The decoding accuracy improved significantly by combining different signal modalities [F(6, 30) = 2.8, p = 0.02, ANOVA]. The combination of all three signals outperformed each single signal modality (no correction for multiple comparisons was used): vs. SUA (t = 2.50, p = 0.03, confidence interval [1.76–30.8], paired t-test), vs. ECoG (t = 2.55, p = 0.02, confidence interval [1.65–24.5], paired t-test), and vs. LFP (t = 2.55, p = 0.02, confidence interval [1.7–25.0], paired t-test). Also, accuracy improved when combining SUA and ECoG (t = 2.24, p = 0.04, confidence interval [0.12–28.4], paired t-test). (B) Correlation between decoding accuracy and the number of single units recorded. The decoding accuracy and the number of single units were non-significantly but positively correlated (Pearson's correlation coefficient 0.66, p = 0.15). (C) Confusion matrix averaged among subjects, based on the optimal feature combination in each subject. Diagonal cells indicate correct classification. All vowels reached the significance level. The decoding accuracy for the optimized signal combination was 58.6 ± 5.1% when averaged across subjects and vowels. Accuracies for each vowel were 54.1 ± 9.3% for /a/, 65.9 ± 21.0% for /i/, 61.3 ± 12.7% for /Ɯβ/, 59.0 ± 8.2% for /e/, and 53.9 ± 17.8% for /o/.

