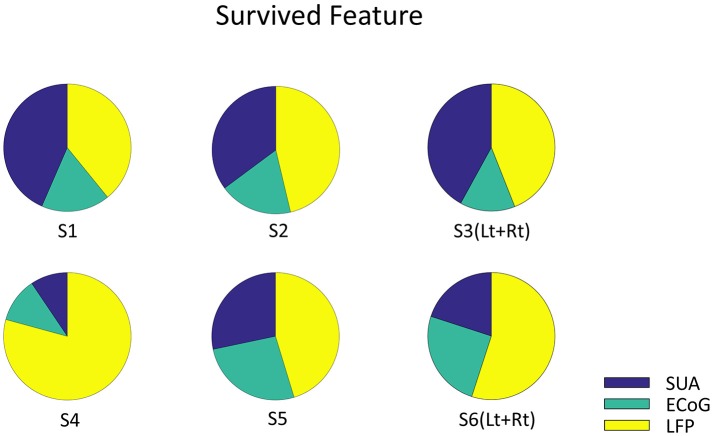
Figure 6.
The Origin of survived feature dimension. Each pie graph represents the signal origin of the survived features. The union of survived features from all the validation were included. Note that the features are derived from all three signals, which implies that these signals complementary computes vowel production.

