
FIGURE 5.
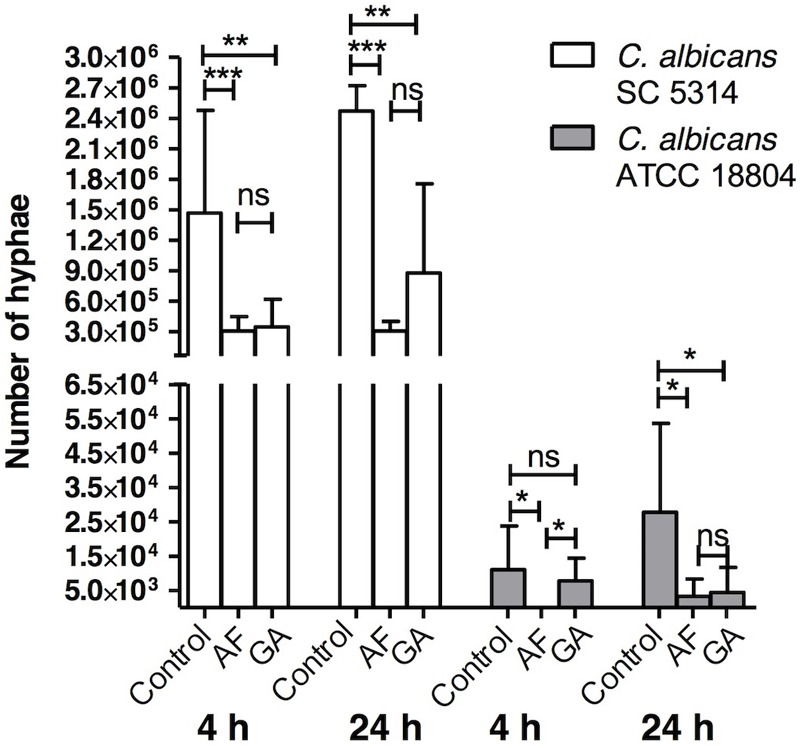
Influence of AF and GA at subinhibitory concentration (half the minimum inhibitory concentration) in hyphae production by C. albicans ATCC 18804 and SC 5314; Kruskal–Wallis test followed by Dunn’s multiple comparison test. ∗P < 0.05; ∗∗P < 0.001; ∗∗∗P < 0.0001; ns, not statistically significant. Tests were performed in triplicate in three independent experiments. Results are expressed as mean and SD, n = 9 for each box.