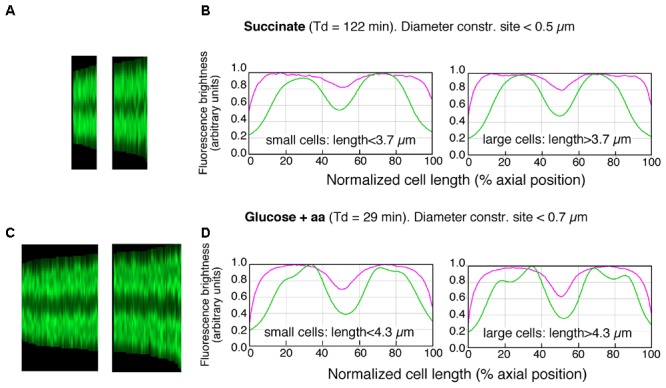
FIGURE 3.

Maps of profiles and collective plots. (A,C) Maps of profiles of DAPI-fluorescence (cf. lower panels in Figures 2A,C) of deeply-constricted cells in slow (A) and fast (C) growing populations; subpopulations of small and large deeply-constricted cells are shown in left and right panels, respectively. (B,D) Collective profiles created from all cell profiles in the maps (A,C) by resampling to a normalized cell length of 100 data points and averaging to a single plot. Mean diameter- (magenta) and DAPI-fluorescence (green) are plotted in arbitrary units of brightness as a function of normalized cell length for slow (B) and fast (D) growing cells; subpopulations of small and large deeply-constricted cells are shown in left and right panels, respectively.
