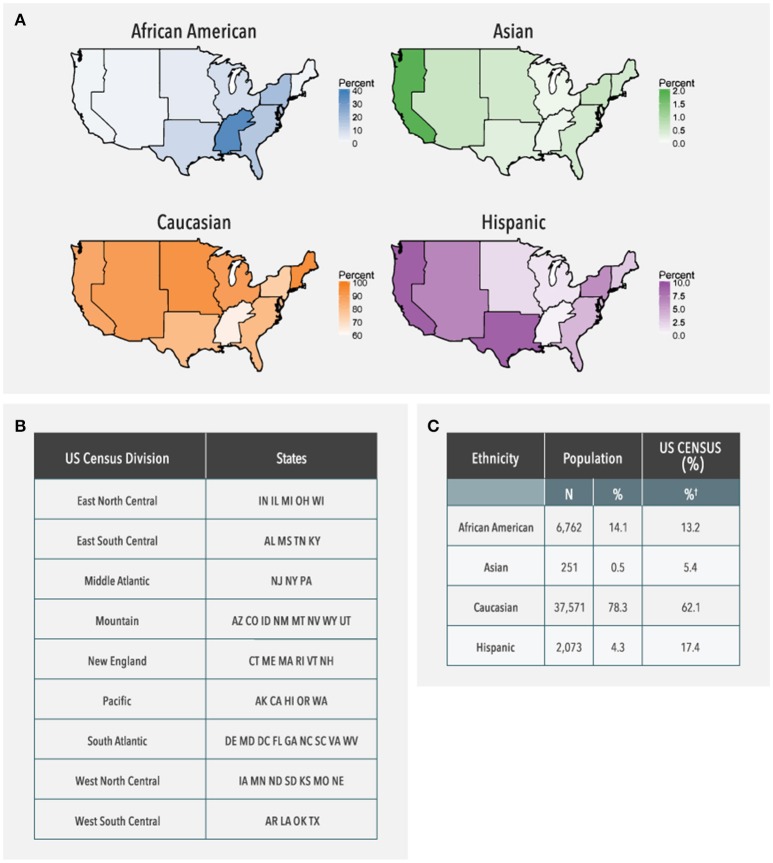
Figure 2.
Ethnicity distribution of the study population based on geographical region. (A) US Maps shaded in proportion to the adjusted frequency of the study population for each ethnicity in each geographic region. The bar next to each choropleth map indicates how the shading varies based on frequency which is adjusted for the percentage of samples with reported ethnicity in each region (38–61%). Alaska and Hawaii are not shown on the choropleth, but were included in the data analysis. (B) Geographic regions as defined by states by the US Census Bureau. (C) Frequency of each ethnic group in the entire study population as compared to expected frequencies from the US Census Bureau. †US Census data is provided only for those groups that are represented in the current study population; therefore, these percentages do not sum to 100%.

