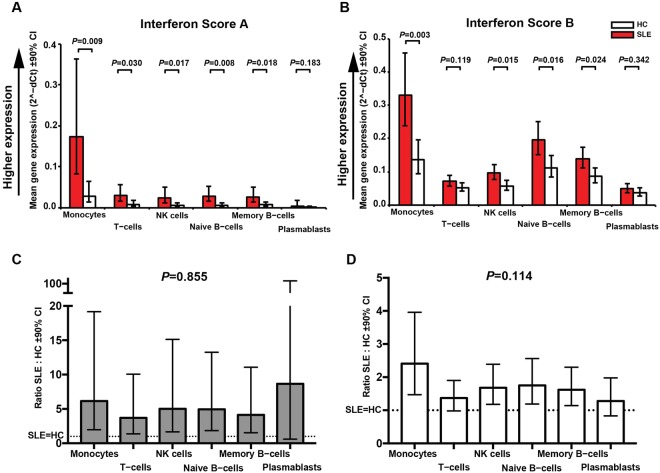
Figure 1.
Comparison of expression of IFN Score A and IFN Score B between sorted immune cell subsets Age-adjusted level of expression (2-dCT) of IFN Score A (Fig. 1A) and IFN Score B (Fig. 1B) in patients with SLE (red) and HC (white) for each cell subsets identified and sorted by flow cytometry of PBMCs. Figures 1C and D show ratio of expression (SLE:HC) for IFN Score A and Score-B respectively. A substantive increase in expression was observed for both scores in each subset. For both scores expression was greatest in monocytes. Dotted lines represent SLE = HC; details in Table S4.

