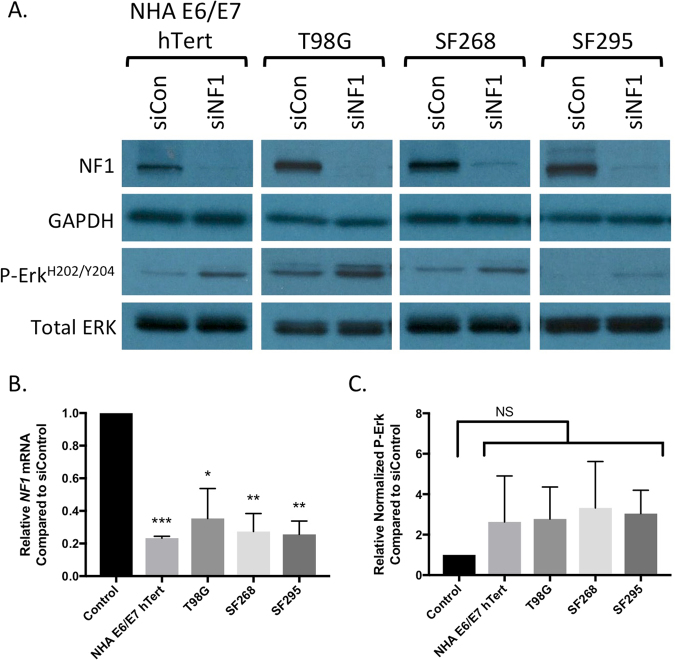
Figure 1.
Confirmation of neurofibromin knockdown by Western blot (A) and quantitative RT-PCR (B) in four cell lines used in the study. All cell lines showed an increase in phosphorylated ERK protein by Western blot (A). (C) Quantitation of the increased phospho-ERK signal did not achieve statistical significance (values are mean +/− standard deviation of 3 independent replicates for NHA, T98G, and SF268, and of 2 replicates for SF295; in a third SF295 assay, P-Erk levels were too low for reliable quantitation).

