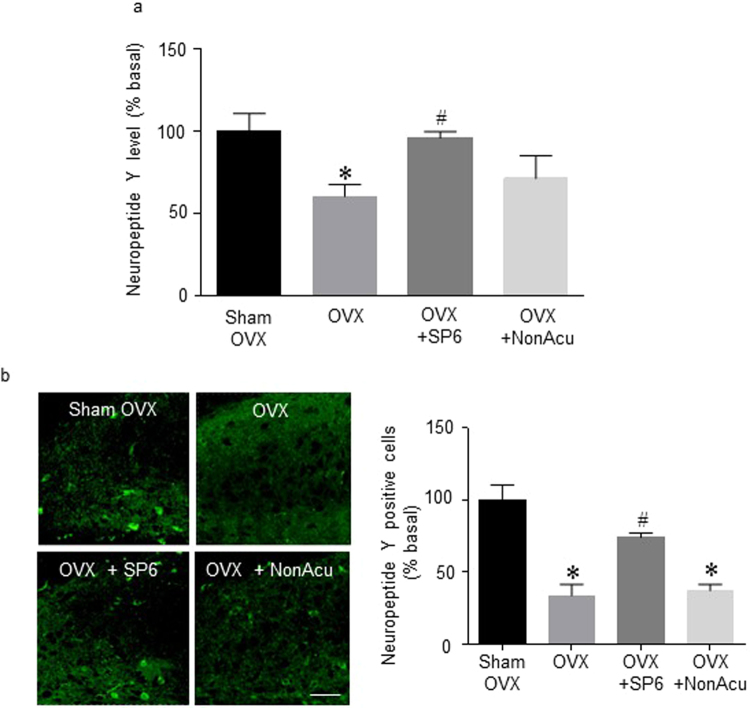
Figure 6.
Effects of acupuncture stimulation on NPY levels in the hippocampus. (a) The release of NPY in the hippocampus (n = 4 for each group). (b) Representative micrographs showing the expression of NPY expression in the hippocampus. The scale bar represents 100 μm. The results are presented as the total number of NPY-immunoreactive cells (n = 4~6 for each group). The mean NPY levels are expressed as a percentage of the control. The data were analyzed using repeated measures ANOVA followed by Tukey’s test. *p < 0.05 vs. Sham group; #p < 0.05 vs. OVX group. Values are expressed as the means ± SEM.

