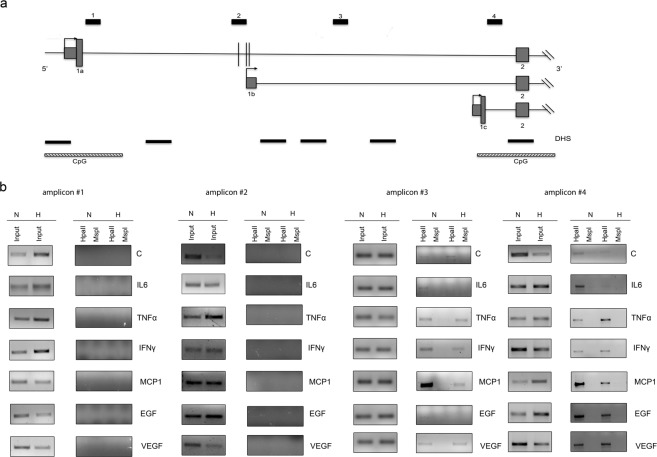
Figure 3.
DNA methylation status of human HIF3A promoter. (a) Schematic diagram of the HIF3A promoter region, CpG islands and DNAse I hypersensitive sites (DHS) surrounding the three transcription start sites. Vertical black lines represent the three methylation sites in intron 1 in association with high BMI25. (b) MS-PCR analysis of genomic DNA extracted from hMSCs exposed to different pro-inflammatory cytokines in normoxic and hypoxic conditions. The locations of PCR amplicons (#1 to #4) are shown in (a). Three independent experiments were performed and a representative experiment is reported. Images derived from different part of the same gel and cropped for layout reasons and included in Suppl. Information.

