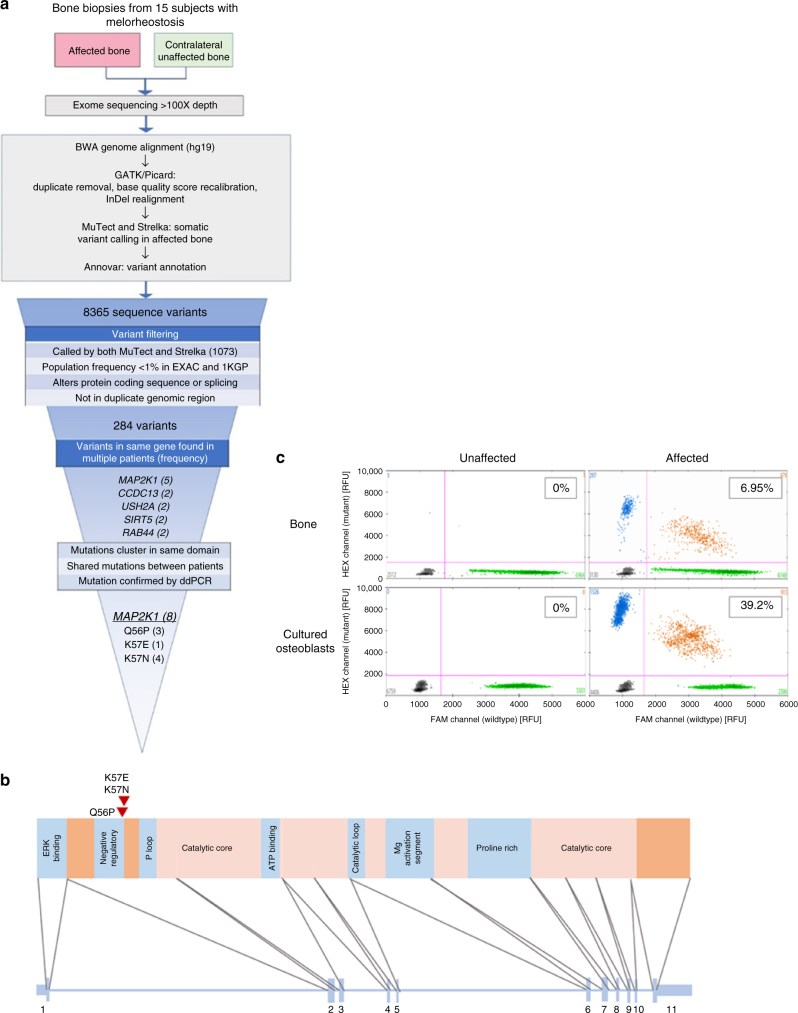
Fig. 2.
MAP2K1 somatic mutations in melorheostotic bone. a Flowchart of genetic analysis. b Schematic of the MAP2K1 exon structure encoding MEK1 protein domains. The three mutations from the eight patients are clustered in the negative regulatory domain. c Quantification of mutant allele abundance by ddPCR in unaffected and affected bone biopsies (top row), as well as in cultured osteoblasts from the respective biopsies (bottom row), from patient Melo-2 identified by WES to have a p.K57N mutation in affected bone. Each dot represents a droplet, with blue being mutant positive, green being wildtype positive, and orange being positive for both. Color-matched numbers correspond to count of droplets per quadrant. The boxed number is the fractional abundance of mutant allele in each sample

