Fig. 4.
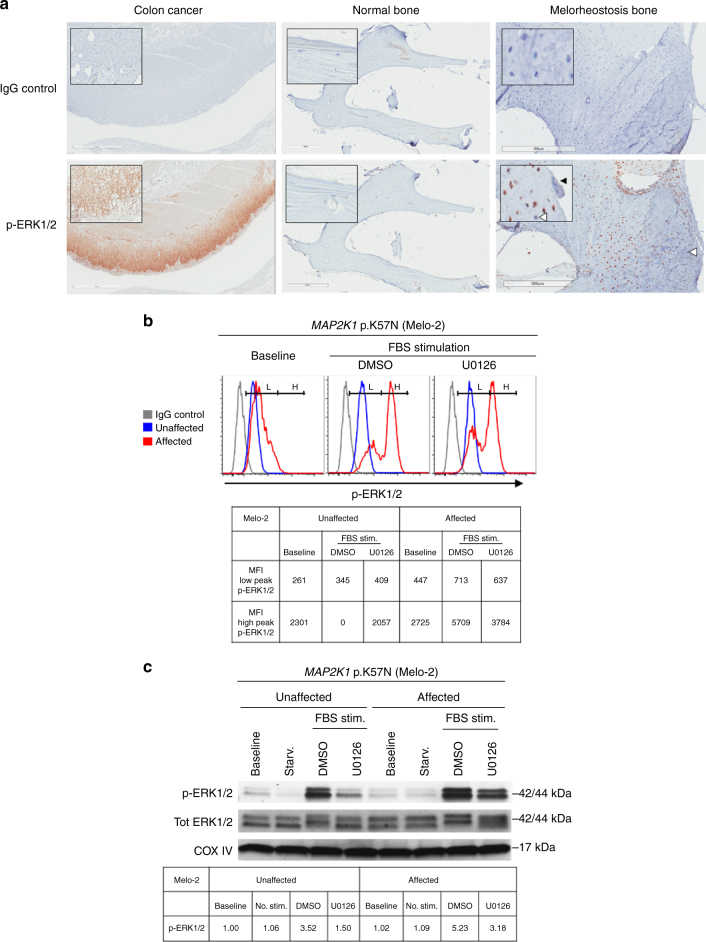
Activation of the MEK1-ERK1/2 pathway by MAP2K1 mutations. a Immunohistochemical analysis of ERK1/2 activation in bone tissues from a melorheostosis patient. Left column shows sections of colon cancer stained with p-ERK1/2-specific antibodies. Marked brown staining is visible. Middle column shows a section of normal bone stained in a similar fashion. Right column shows representative section from melorheostotic bone (Melo-18, MAP2K1 p.K57N, VAF 46%) stained with p-ERK1/2-specific antibodies. Osteocytes stain brown surrounded by woven bone. Cells positive for p-ERK1/2 are also seen in the periosteum. Inset shows high-power view of positively staining cells. A multinucleated osteoclast which does not stain for p-ERK1/2 is marked by the solid arrow. Cells negative for p-ERK1/2 are noted by the open arrows. See Supplementary Figure 3 for staining of SW48 colon cancer cells, which harbor the MAP2K1 p.K56P mutation. b p-ERK1/2-specific flow cytometry analysis. Affected and unaffected osteoblasts from Melo-2 (MAP2K1 p.K57N, VAF 45%) were stimulated with serum with or without MEK inhibitor U0126. Two peaks in the histogram indicates cell subpopulations of distinct level of p-ERK1/2 upon serum-stimulation in osteoblasts from affected bone (red), cells from unaffected bone (blue) only showed a single peak. U0126 reduced p-ERK1/2 in cells from affected bone. Cells stained with matching rabbit IgG isotype control are also shown (gray). The geometrical mean channel fluorescence is shown below for the high and low peaks of p-ERK1/2 marked on the histograms. c Western blot analysis of osteoblasts from affected and unaffected bone of patient Melo-2 (MAP2K1 p.K57N, VAF 45%) shows increased ERK1/2 activation (p-ERK1/2) by MEK1 mutation in affected osteoblasts (lane 7 of p-ERK1/2 blot), as compared to unaffected osteoblasts (lane 3), by serum-stimulation. Inhibition of MEK1 with U0126 significantly diminished p-ERK1/2 in both affected and unaffected, but the level of p-ERK1/2 was still higher in affected osteoblasts compared to unaffected (lanes 4 and 8). Quantification data of band intensities are shown in a table. COX IV was used as control for equal amount protein loading

