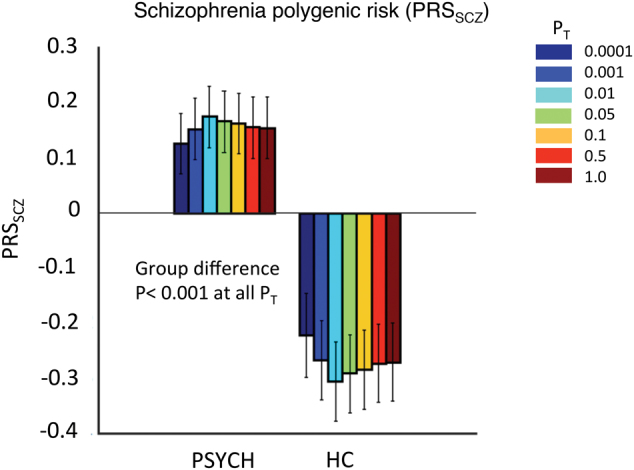
Fig. 1. Mean Polygenic scores of schizophrenia (PRSSCZ) in the psychotic (PSYCH, N = 314) and the healthy controls (HC, N = 180) in B-SNIP.

The vertical black lines show the standard errors of the mean (SEM). Scores were calculated at seven p-value thresholds (PT): 0.0001, 0.001, 0.01, 0.05, 0.1, 0.5, and 1.0 (shown in different colors). All scores were z-transformed before mean and SEM calculation. PRSSCZ was significantly higher (p ≤ PFDR = 2.6 × 10⁻⁴, Kruskal–Wallis test) in the PSYCH group compared to the HC group at all PT. Table S1 shows the p-values for this analysis. NPFAM (nonpsychotic family members of PSYCH group probands) were excluded from this case-control analysis so that only unrelated individuals were compared
