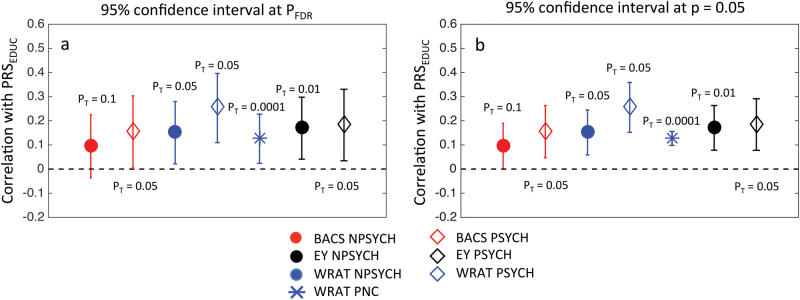
Fig. 4. Correlations of the polygenic score of educational attainment (PRSEDUC) with the Brief Assessment of Cognition in Schizophrenia score (BACS), premorbid intellectual potential (WRAT), and educational attainment (EY).
For B-SNIP: N = 314 (PSYCH), N = 423 (NPSYCH) and for PNC: N = 4511. All markers other than the blue star, which represents PNC, show results for B-SNIP. Correlation coefficients are shown with 95% confidence intervals for FDR-corrected threshold (PFDR-B-SNIP = 0.0064, PFDR-PNC = 3.1 × 10⁻¹²) (a) and p = 0.05 (b). Only the strongest correlation (Spearman’s Rank method) for each phenotype is shown with the corresponding PT labeled. Correlation coefficients and corresponding p-values for all PT can be found in Tables S5 and S6

