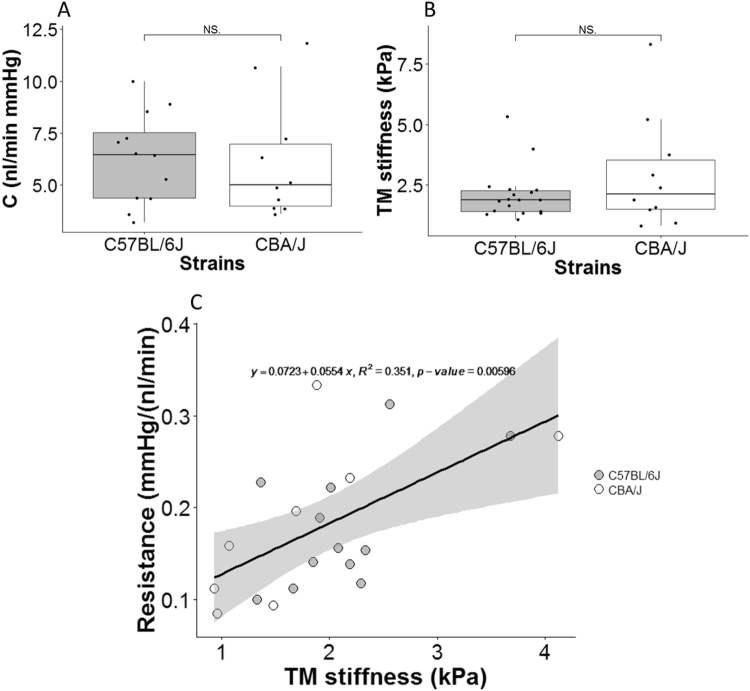
Figure 1.
(A) Outflow facility (C) and (B) TM stiffness for two mouse strains. For each box, the central line represents the median, and the edges of the box are the 25th and 75th percentiles, and whiskers extend to the most extreme data points not considered outliers. Each dot represents the data from one eye per mouse, as described in more detail in the Statistical Analysis section. Due to technical issues, not all measurements in all mice were successful; number of eyes shown for facility plot are n = 12 for C57BL/6 J and n = 10 for CBA/J. For stiffness plot, the respective values are n = 18 and n = 10. NS: Not Significant. (C) Cross-plot between outflow resistance (1/C) and TM stiffness, with each data point representing one mouse. The black solid line and equation represent the linear regression of the pooled data. The gray-shaded region shows 95% confidence bounds for the regression. For each mouse, only the data from the OD eye was used, except in cases where the OD eye yielded invalid facility data due to technical issues, in which case data from the OS eye was used. Only mice where both outflow resistance and TM stiffness were measured in the same eyes were included. Number of data points: n = 12 for C57BL/6 J, n = 8 for CBA/J.

