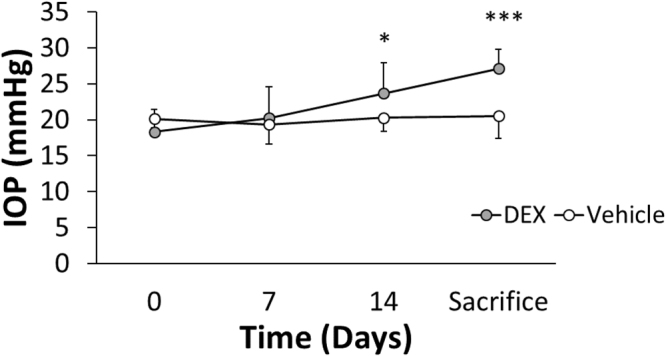
Figure 2.

IOP as a function of time for DEX-treated (grey) and vehicle-treated (white) mice averaged over five cohorts. For cohort 1 and 2, DEX or vehicle were injected on day 0 and 14. For cohort 3–5, injections were performed on day 0, 7 and 14. All IOPs were measured immediately before injections. Bars are standard deviation. *p < 0.05, ***p < 0.001. p-values were Benjamini-Hochberg corrected. For each mouse, only the data from the OD eye was used. At day 0, 7 and 14, n = 25 DEX-treated mice and n = 16 vehicle-treated mice. At the day of sacrifice (day 20–40 depending on cohort), n = 24 DEX-treated mice and n = 15 vehicle-treated mice. Two mice were injured during fighting and were euthanized at day 14.
