Figure 3.
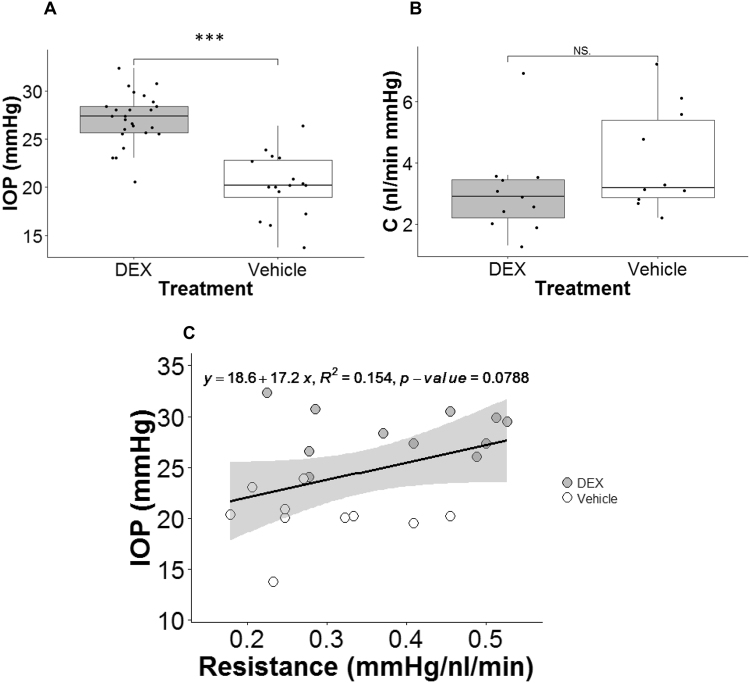
DEX treatment affected IOP and outflow facility. (A) Boxplot of IOP for DEX-treated (n = 25) and vehicle-treated mice (n = 16). (B) Boxplot of outflow facility (C) for DEX-treated (n = 11) and vehicle-treated mice (n = 10). For each box, the central mark is the median, the edges of the box are the 25th and 75th percentiles, and whiskers extend to the most extreme data points not considered outliers. Each dot represents the data from one eye. (C) IOP measured on the day mice were sacrificed plotted as a function of outflow resistance (1/C) for DEX-treated (grey dots, n = 11) and vehicle-treated (white dots, n = 10) mice. The black solid line is the best fit using linear least squares regression. The gray-shaded region shows 95% confidence bounds for the regression. ***p-value < 0.001. NS.: Not Significant. Data in panels B and C are from cohort 3–5.

