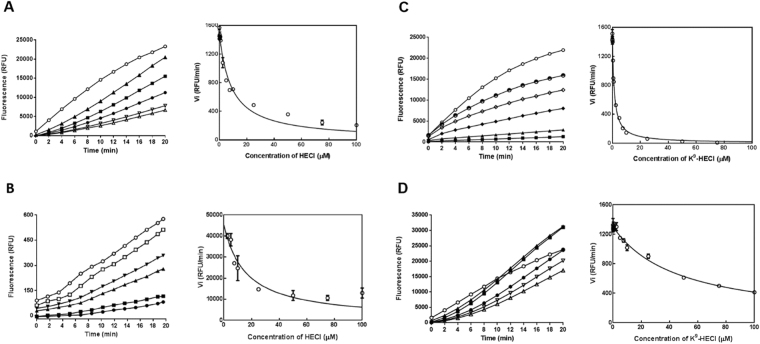
Figure 4.
Inhibitory activity of HECI and the Lys-substituted analogue on trypsin, chymotrypsin and the 20 S proteasome. (A) Progress curves and corresponding Morrison plot for chymotrypsin proteolysis in the presence of different concentrations of HECI. (B) Progress curves and corresponding Morrison plot for human proteasome 20 S proteolysis in the presence of different concentrations of HECI. (C) Progress curves and corresponding Morrison plot for trypsin proteolysis in the presence of different concentrations of K9-HECI. (D) Progress curves and corresponding Morrison plot for chymotrypsin proteolysis in the presence of different concentrations of K9-HECI. (△ 100 μM, ▽ 75 μM, ● 50 μM, ■ 25 μM, ▲ 10 μM, ▼ 7.5 μM, □ 5 μM, ♦ 2.5 μM, ◇ 1 μM, ◓ 0.25 μM, ○ 0 μM).

