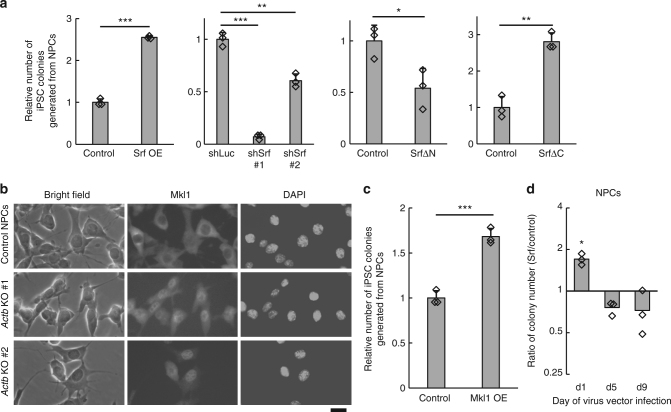
Fig. 3.
Srf and its cofactor, Mkl1, promote reprogramming. a Srf promotes reprogramming. Values are means ± SD of the numbers of iPSC colonies produced relative to control cells (n = 3). OE indicates overexpression. Dots indicate individual data points. Student’s t-test (***P < 0.0005, **P < 0.005, *P < 0.05). b Mkl1 mainly localizes in the nucleus upon β-actin depletion. Immunofluorescence microscopy of NPCs using anti-Mkl1 antibody and images of the corresponding bright field and DAPI staining. Bar, 20 µm. c Mkl1 promotes reprogramming. Values are means ± SD of numbers of iPSC colonies generated from NPCs relative to the control (n = 3). Dots indicate individual data points. Student’s t-test (***P < 0.0005). d Srf promotes reprogramming at early phase. NPCs were infected with egfp-expressing lentivirus or Srf-overexpressing lentivirus at the days indicated (d1 is the day of reprogramming initiation by Dox addition). Vertical axis shows the reprogramming efficiency of Srf-overexpressing cells to egfp-expressing cells in logarithmic (log) scale (n = 3). Dots indicate individual data points. Asterisks indicate statistically significant differences between Srf overexpression and control on the day of virus infection (Student’s t-test; *P < 0.05)

