Fig. 4.
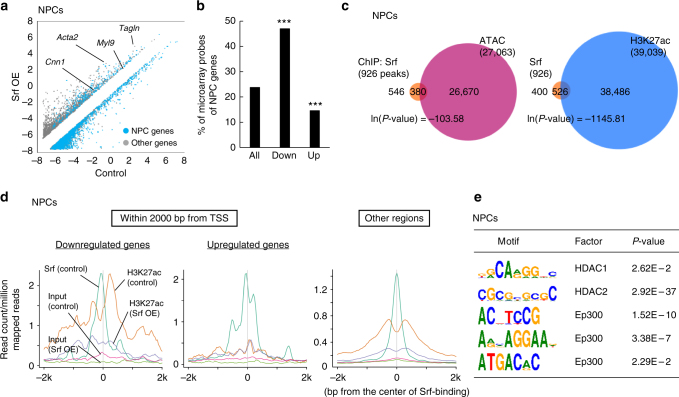
Srf preferentially downregulates cell-type-specific genes. a A scatter plot showing gene expressions that are > 2-fold different between Srf-overexpressing NPCs and control cells. Blue dots show NPC genes, which are defined as genes whose expression levels in NPCs are > 2-fold compared with those in ESCs. b Cell-type-specific genes are enriched in genes downregulated by Srf overexpression. Asterisks indicate a significant difference between genes in the indicated group and all other genes (two-sided Fisher’s exact test; ***P < 0.0005). c Srf preferentially binds to open and H3K27ac-marked genomic regions. The peak number in the overlapped area is based on the number of Srf-binding peaks. Overlaps were analyzed by the hypergeometric test. d Srf removes adjacent H3K27ac in NPCs. Means of ChIP-seq signals around genomic regions to which Srf was bound within 2000 bp from TSS (left panels) and other regions (right panel). e Matrices of consensus binding motifs of HDACs and Ep300 are enriched near Srf-binding sites. Motif analyses of ChIP-seq data of Srf in NPCs indicated that matrices of the motifs of HDAC1, HDAC2, and Ep300 were enriched within 25 bp of the Srf-binding sites in NPCs. Fisher’s exact test

