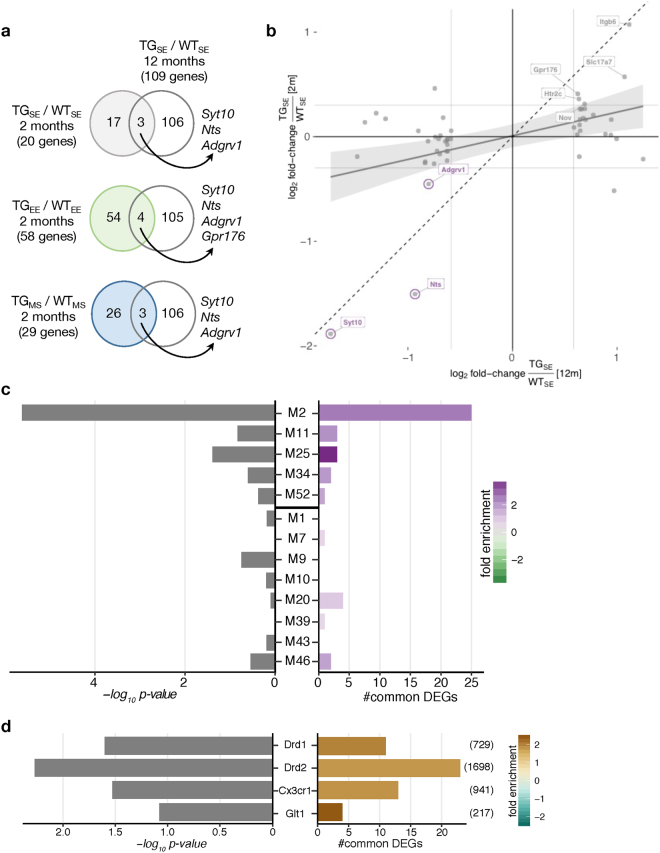
Figure 2.
Later-state dysregulation of striatal gene expression induced by mHTT surfaced early on. (a) Venn diagram comparing differentially expressed genes in 2-month-old BACHD rats housed in one of the three tested environmental conditions with 12-month-old BACHD rats housed in the standard environment12. (b) Scatter plot of gene expression changes between WT and BACHD rats at 2 months (x-axis) and 12 months of age (y-axis). Striatal DEGs in 12-month-old BACHD rats12 plotted in grey. Striatal DEGs also identified in 2-month-old rats labelled in purple. Linear regression line with standard error shown in grey. Dashed line represents ordinary diagonal. Grey labels indicate DEGs that reached significance in 12-month-old but not in 2-month-old rats. (c) Enrichment of DEGs in 2-month-old rats (TG/WT for all three environments) for genes in HD consensus modules11. Genes in the upper five modules are downregulated and in the lower eight modules upregulated in a CAG length-dependent manner. Bars show p-values of two-sided Fisher’s exact test and number of common genes. (d) Enrichment of DEGs in 2-month-old rats (TG/WT for all three environments) for distinct striatal cell types characterized by sorting Drd1-, Drd2-, Glt1-, and Cx3cr1-positive striatal cells in mice. Number of cell type-specific genes (padj < 0.1) indicated in brackets on right. Bars show p-values of two-sided Fisher’s exact test and number of common genes.

