
Figure 1.
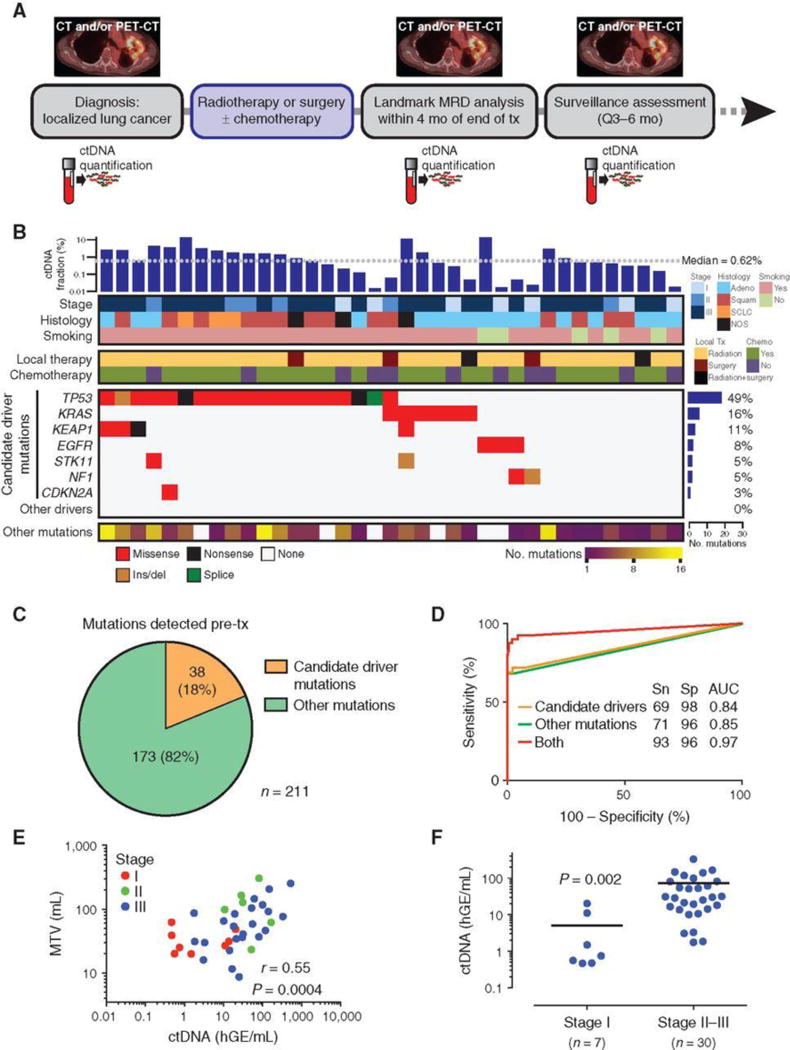
Pretreatment assessment of ctDNA in patients with localized lung cancer. A, Study schematic. Patients with biopsy- and imaging-proven nonmetastatic lung cancer were enrolled pretreatment. Plasma samples were collected before treatment and at follow-up visits, which occurred every 3–6 months and were usually coincident with surveillance scans (CT or PET/CT). B, Co-mutation plot based on pretreatment ctDNA analysis of patients with localized lung cancer. Each column represents pretreatment data from a single patient. Mutant allele fraction is shown in the top bar graph. Top heat maps indicate key patient characteristics. Mutation recurrence rate is depicted by bar graph to the right. Nonsynonymous mutations in candidate driver genes are shown in descending order of prevalence in the middle heat map. The number of other (i.e., likely passenger) mutations detected is indicated in the bottom heat map. C, Pie chart showing the number of candidate driver and other mutations detected in pretreatment plasma. D, ROC analysis of pretreatment (n = 40) and healthy control (n = 54) plasma samples using candidate driver, other, or both types of mutations. E, Scatter plot correlating ctDNA concentration (haploid genome equivalents per mL, hGE/mL) with pretreatment metabolic tumor volume (MTV) measured by PET-CT in patients with detectable ctDNA (n = 37). P value and r were calculated by Pearson correlation. F, Pretreatment ctDNA concentration in stage I (n = 7) and stage II–III (n = 30) patients with lung cancer. Data represent mean + SEM. P value was calculated by the Student t test with Welch correction. mo, months; tx, treatment; adeno, adenocarcinoma; squam, squamous cell carcinoma; NOS, not otherwise specified; Sn, sensitivity; Sp, specificity; AUC, area under the curve; PET, positron emission tomography; CT, computed tomography.