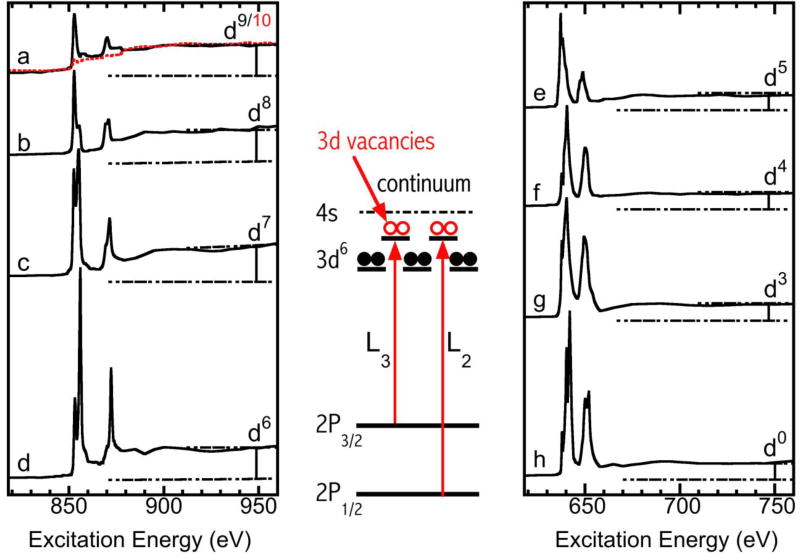
Figure 1.
Normalized L-edge XAS spectra. Left panel (from top to bottom): Na2[Ni0(RS)4] (a, dashed red line), Na[NiI(RS)4] (a, black line), NiIIO (b), K3NiIIIF6 (c), KNiIVIO6 (d); right panel (from top to bottom): MnIIO (e), LiMnIIIO2 (f), MnIVO2 (g), KMnVIIO4 (h); the schematic energy diagram in the middle panel illustrates the 3d holes and the L3 and L2 (2p→3d) transitions.

