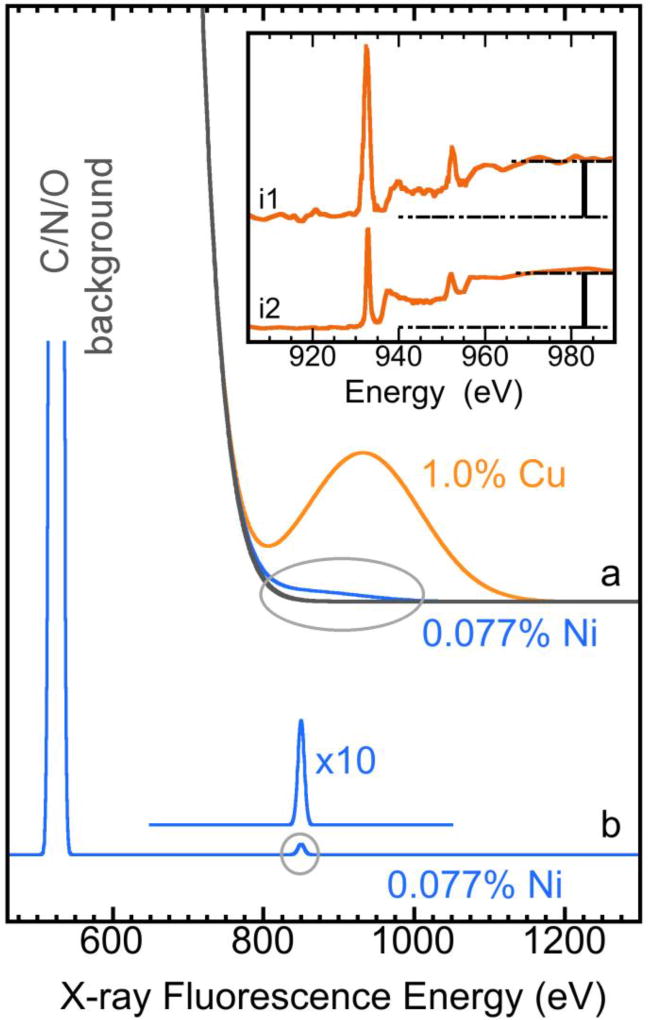
Figure 4.
An theoretical X-ray fluorescence spectrum for a hypothetical sample of 1% Cu and 0.077% Ni and O in balance: (a) measured with a 180 eV energy resolution X-ray fluorescence detector; or (b) measured with an STJ detector with 15 eV energy resolution; Inset: the normalized L XAS for Cu proteins from engineered azurin (i1)5 and from plastocyanin (i2)6 measured with a 180 eV Ge detector.

