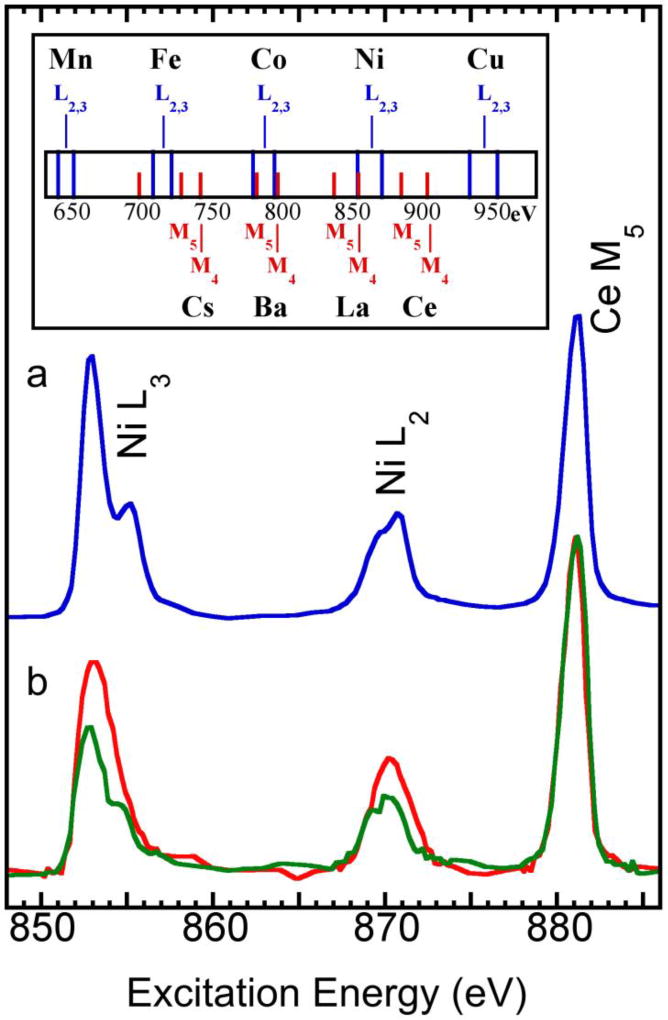
Figure 6.
Ni L XAS spectra for the 0.6% wt. Ni in a NiBr2 matrix (a, blue), along with the as-isolated (b, red) and H2-reduced (b, green) D. gigas NiFe H2ase. All samples are doped with chemically-inert Ce(NO3)3. The top inset shows the M-edge positions for various rare earth elements in the region of 600–1000 eV.

