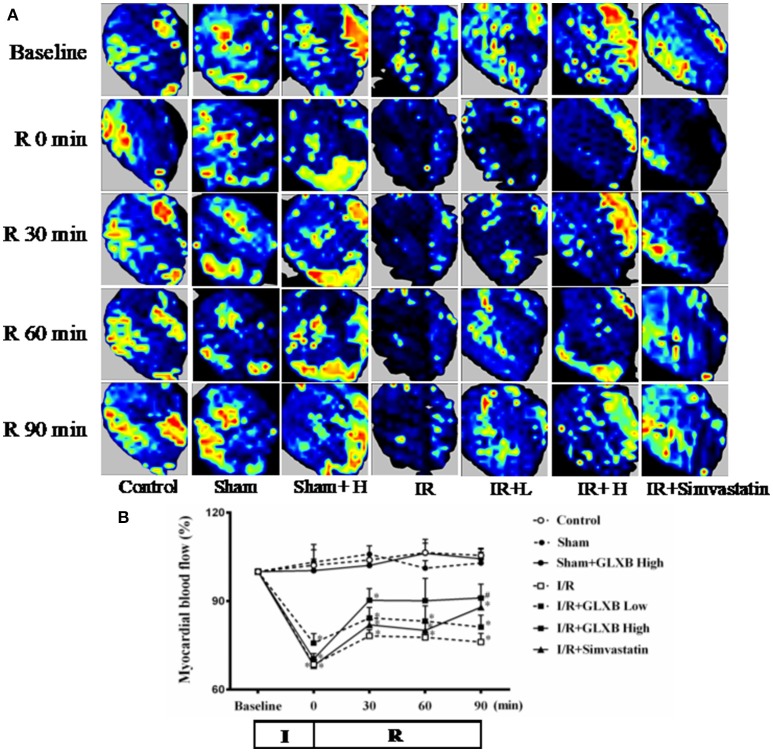
Figure 10.
The effect of GLXB on MBF after I/R in rats. (A) Color images of MBF acquired by Laser Scanning Doppler Perfusion Imager in Control, Sham, Sham + GLXB High, I/R, I/R + GLXB Low, I/R + GLXB High, I/R + Simvastatin groups at Baseline, 0, 30, 60, and 90 min after reperfusion. (B) Time courses of MBF of rats subjected to I/R in various groups. The linear mixed effects models were analyzed for repeated measurement data, and least squares means were calculated between the groups of different time points. Data are mean ± SEM, n = 6. *P < 0.05 vs. Sham group, #P < 0.05 vs. I/R group.

