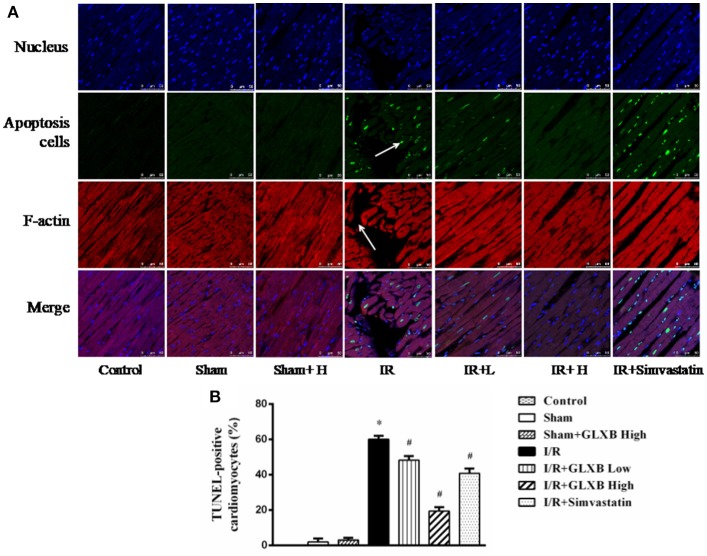
Figure 8.
The effect of GLXB on myocardial apoptosis. (A) Representative photographs of double staining of TUNEL and F-actin (40×). Nucleus are stained with blue, F-actin red, and TUNEL-positive cells green. Bar = 50 μm. (B) Quantitative analysis of apoptosis cells in the various groups. Data are mean ± SEM, n = 6. *P < 0.05 vs. Sham group, #P < 0.05 vs. I/R group.

