. 2018 Mar 30;38(4):355–361. doi: 10.3343/alm.2018.38.4.355

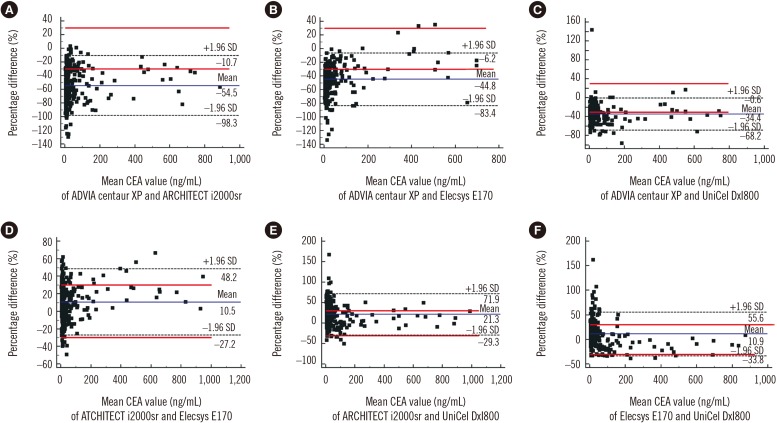
Fig. 2. Method comparison of four carcinoembryonic antigen (CEA) immunoassays using Bland-Altman plots in 393 serum samples. The solid line indicates the % difference from the averages of two assays. Dashed lines indicate the upper and lower 95% confidence limits of % difference between two analyzers. The red lines are the acceptable bias limits of 30.0%. Comparison of CEA concentrations between ADVIA Centaur XP and ARCHITECT i2000sr (A), ADVIA Centaur XP and Elecsys E170 (B), ADVIA Centaur XP and UniCel DxI800 (C), ARCHITECT i2000sr and Elecsys E170 (D), ARCHITECT i2000sr and UniCel DxI800 (E), and Elecsys E170 and UniCel DxI800 (F).

Fig. 2