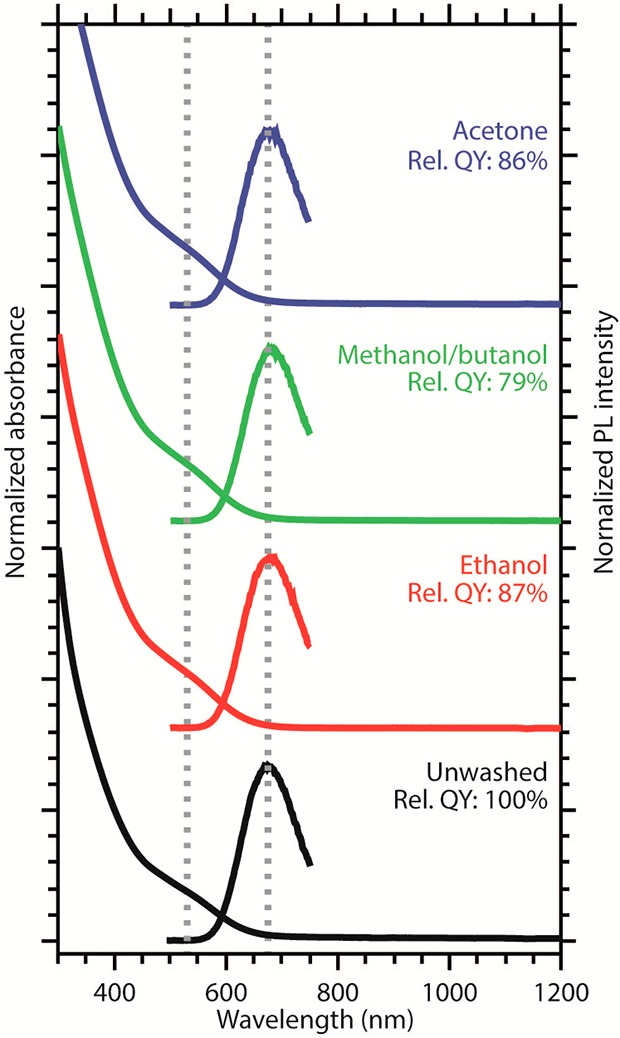
Figure 3.

Absorption and PL spectra of unwashed CIS NCs (black) and CIS NCs that were washed with either ethanol (red), methanol/butanol 1:1 mixture (green), or acetone (blue). The dotted lines mark the absorption and PL maxima. The relative PL QYs are also given. The NCs are all from the same batch and differ only with respect to the washing procedure.
